Democratic Underground Latest Greatest Lobby Journals Search Options Help Login
Google

Dear climate-change deniers:

Printer-friendly format Printer-friendly format
Printer-friendly format Email this thread to a friend
Printer-friendly format Bookmark this thread
This topic is archived.
Home » Discuss » General Discussion Donate to DU
 
Brigid Donating Member (1000+ posts) Send PM | Profile | Ignore Tue Nov-08-11 12:41 PM
Original message
Dear climate-change deniers:
Edited on Tue Nov-08-11 12:53 PM by Brigid
It is 67 degrees outside right now, in Indiana, on November 8. I don't know if that is a record, but I don't ever recall going outside in November wearing a T-shirt and no coat or jacket at all. Not only that, but I still have yet to break out my warm coats. Not even close. Care to explain that?
Printer Friendly | Permalink |  | Top
brendan120678 Donating Member (1000+ posts) Send PM | Profile | Ignore Tue Nov-08-11 12:47 PM
Response to Original message
1. While I am not a "denier" myself, most of the...
so-called "Climate Changed Deniers" that I know of don't dispute that there has been climate fluctuation.
They deny that the changes are man-made (or man-caused).
Printer Friendly | Permalink |  | Top
 
SheilaT Donating Member (1000+ posts) Send PM | Profile | Ignore Tue Nov-08-11 01:20 PM
Response to Reply #1
2. I believe that some of them are actually
denying that any significant change is occurring.

There's a claim out there that average temperatures have not risen since 1996 or 2003 or I forget exactly which year they're saying but they're absolutely wrong about it.
Printer Friendly | Permalink |  | Top
 
DesMoinesDem Donating Member (90 posts) Send PM | Profile | Ignore Tue Nov-08-11 02:10 PM
Response to Reply #2
7. That actually is true. And admitting it doesn't make you a denier.
The recent Berkeley Earth Surface Temperature study shows no warming trend over the last decade.

Printer Friendly | Permalink |  | Top
 
SheilaT Donating Member (1000+ posts) Send PM | Profile | Ignore Tue Nov-08-11 03:41 PM
Response to Reply #7
11. Umm, that's not what a quick google search says.
One site says that 2010 was the warmest year on record, tied with 2005. http://www.skepticalscience.com/global-warming-stopped-in-1998.htm

The Wikipedia article on the Berkeley Earth Surface Temperature study says the warming trend is real, although there's nothing in that article about recent years being warmer than ever.

NOAA says (as of August 2010)that the past decade was the warmest on record. Somehow none of that matches a statement that there's no warming trend over the last decade.
Printer Friendly | Permalink |  | Top
 
DesMoinesDem Donating Member (90 posts) Send PM | Profile | Ignore Tue Nov-08-11 07:04 PM
Response to Reply #11
17. Well there's more to data than a quick google search. There is the data itself.
Here is the data for the last decade from the best study plotted on a graph. It shows no sadistically significant warming.

Printer Friendly | Permalink |  | Top
 
Viking12 Donating Member (1000+ posts) Send PM | Profile | Ignore Tue Nov-08-11 08:21 PM
Response to Reply #17
20. Fail. The "Global Warming Policy Foundation" is anti-scientce propaganda
Their "Advisors" is a list of denier who's who.
Printer Friendly | Permalink |  | Top
 
DesMoinesDem Donating Member (90 posts) Send PM | Profile | Ignore Wed Nov-09-11 12:40 AM
Response to Reply #20
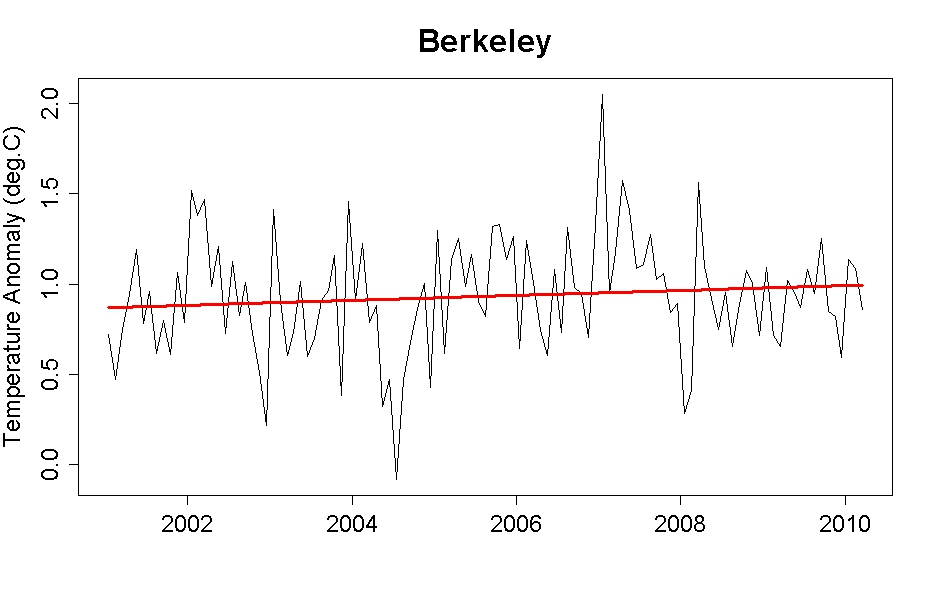
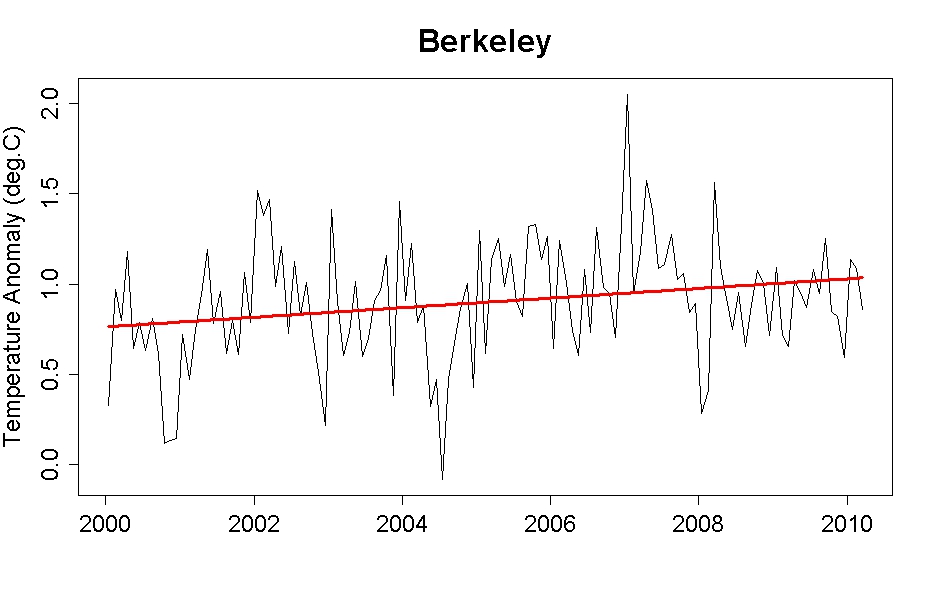
21. WTF are you talking about? It is a graph from the data.
Edited on Wed Nov-09-11 12:42 AM by DesMoinesDem
The person that plotted the data on a graph is irrelevant. Just more fallacious arguments from you. Major FAIL on your part. Graph it yourself and you'll get the same thing. Hell I'll do it for you.


And HadCRUT3 is going to show you the same thing.

Printer Friendly | Permalink |  | Top
 
Viking12 Donating Member (1000+ posts) Send PM | Profile | Ignore Wed Nov-09-11 07:30 AM
Response to Reply #21
23.  Why do you include bad data knowingly? Why does Global Warming Policy Foundation?
Printer Friendly | Permalink |  | Top
 
DesMoinesDem Donating Member (90 posts) Send PM | Profile | Ignore Wed Nov-09-11 11:36 AM
Response to Reply #23
24. The data is part of the dataset. It wasn't just invented. BEST included it so it is used.
Why do you pretend that it doesn't exist? Probably because you think it makes some argument you are trying to make look better. If you don't like the BEST data then look at HadCRUT3. It shows the same thing.
Printer Friendly | Permalink |  | Top
 
Viking12 Donating Member (1000+ posts) Send PM | Profile | Ignore Wed Nov-09-11 12:13 PM
Response to Reply #24
27. I don't 'pretend' it doesn't exist. It doesn't exist.
Here's the data:

http://berkeleyearth.org/data.php

Show me where there's a complete coverage for the global land area after Feb 2010. It is simply not there. The data is for a limited area of the Antarctic. To use that limited data to represent global temperature is a fundamental lie.

I like the BEST data where it is a complete representation, up to February 2010. It is completely consistent with GISS, UAH, RSSS, NCDC datasets which ALL show warming over the last decade.
Printer Friendly | Permalink |  | Top
 
DesMoinesDem Donating Member (90 posts) Send PM | Profile | Ignore Wed Nov-09-11 02:00 PM
Response to Reply #27
30. You say it doesn't exist, yet admit it does exist.
The data wasn't just made up and put on a graph. It exists. You don't like it, fine, but to say it doesn't exist is a lie that you made and are now trying to excuse your way out of. But that is irrelevant. Look at HadCRUT3. It shows the same trend. There has been no statistically significant warming over the last decade.
Printer Friendly | Permalink |  | Top
 
Viking12 Donating Member (1000+ posts) Send PM | Profile | Ignore Wed Nov-09-11 02:41 PM
Response to Reply #30
31. You're arguing that we should determine national elections based on a vote in Wyoming.
and no ballots cast in any other state. There is NO data from the vast majority of the global landmass post February 2010, only data from 47 stations in Antarctica. The rest of the data does not exist. Period.


And now you move the goalposts, too. From 'no warming' to 'no statistically significant warming'.

I can see now you're clearly dishonest and don't deserve to be taken seriously.
Printer Friendly | Permalink |  | Top
 
DesMoinesDem Donating Member (90 posts) Send PM | Profile | Ignore Wed Nov-09-11 05:34 PM
Response to Reply #31
37. You have no idea what you're talking about.
You know that link you have to the data? Take the data from that link and plot it on the graph starting in 2001. Whose graph do you get? The answer is mine, not yours. Why is that? Because data exists past when you claimed it didn't... because you were lying. YOU keep changing the goalposts to try to get out of your LIE. And no warming and no statistically significant warming are the same thing, genius. If you look at HadCRUT3, which you obviously are trying to avoid, there is a slight cooling trend, but it isn't statistically significant. I would also say for HadCRUT3 that there is no warming and no statistically significant warming. Clearly you are dishonest, seeing how you said the data didn't exist when it clearly does and because you refuse to look at other data which clearly defeats any argument you are trying to make.
Printer Friendly | Permalink |  | Top
 
Viking12 Donating Member (1000+ posts) Send PM | Profile | Ignore Wed Nov-09-11 05:56 PM
Response to Reply #37
39. Why don't you address the issues I point out? Where is the data in the BEST set? Show me the data!
Edited on Wed Nov-09-11 06:16 PM by Viking12
Again, here's the full dataset. http://berkeleyearth.org/data.php Show me where there's complete geo-spatial coverage after February 2010. List the stations. Come 'on, I dare you.

I'll save you the trouble, here are the only 47 stations present in the BEST dataset in the months following Feb 2010. If you use the data beyond February 2010, you are clearly a liar. And yes, you innumerate, there is a difference between 'no warming' and 'no statistically significant warming'.

Name Lat
MIRNYJ -66.5400
SYOW -69.0000
Elizabeth -82.6000
AMUNDSEN-SCOTT -90.0000
NICO -89.0000
LETTAU -82.5180
GILL -80.0090
BYRD -80.0000
MARILYN -79.9500
SCHWERDTFEGER -79.8750
MINNA BLUFF -78.5500
VOSTOK -78.4800
LINDA -78.4755
PEGASUS NORTH -77.9250
FERRELL -77.8840
MCMURDO SOUND NAF -77.8734
NAVY OPERATED(AMOS) -77.5000
CAPE ROSS -76.7170
HALLEY BAY -75.5000
DOME C II -75.1210
MANUELA -74.9460
BUTLER ISLAND -72.2060
POSSESSION ISLAND -71.8910
NOVOLAZAREVSKAJA/LAZREV-1/61 -70.7670
GEORG VON NEUMAYER, FRG ANT.. -70.6608
ZHONGSHAN WX OFFICECI -69.3670
DAVIS -68.5777
ROTHERA POINT -67.6062
MAWSON -67.6000
LAW DOME SUMMIT -66.7330
DUMONT D'URVILLE, FRANCE ANT. -66.6670
CASEY -66.3320
B. A. VICECOMODORO MARAMBIO -64.2330
BASE ESPERANZA -63.4000
ISLAS ORCADAS B.N. -60.7360
MACQUARIE ISLAND -54.4941
MARION ISLAND -46.8738
GOUGH ISLAND -40.3500
Henry -89.0000
Limbert -75.4000
Mario Zucchelli -74.7000
GENERAL SAN MARTIN B.E. -68.1300
Larsen Ice Shelf -66.9000
BELLINGSHAUSEN -62.2000
TENIENTE JUBANY E. C., ARG. -62.2000
GRYTVIKEN S. GEORGIA IS. -54.2700
Campbell -52.0000


Please explain to us all why this limited data should be included in a graph supposedly representing the global landmass. I'm sure you will once again try to change the subject.

Even if we use the bad data and factor the last full decade in the BEST data set (an actual whole decade, not your truncated decade starting in Jan 2001 but 120 months June 2000-May2010) there's a positive trend. http://www.woodfortrees.org/graph/best/from:2000.6/plot/best/from:2000.6/trend
Printer Friendly | Permalink |  | Top
 
SheilaT Donating Member (1000+ posts) Send PM | Profile | Ignore Wed Nov-09-11 12:44 AM
Response to Reply #17
22. Possibly not sadistically significant warming,
but all the reliable scientists says there's statistically significant warming.
Printer Friendly | Permalink |  | Top
 
we can do it Donating Member (1000+ posts) Send PM | Profile | Ignore Wed Nov-09-11 05:37 PM
Response to Reply #17
38. WTF Is Sadistical Warming?
Printer Friendly | Permalink |  | Top
 
SeattleVet Donating Member (708 posts) Send PM | Profile | Ignore Tue Nov-08-11 04:18 PM
Response to Reply #7
13. 10 years does not a climate make...
if you go in small, selected chunks, you wind up with a series of 'cooling' trends, but miss out on the overall warming trend:


Printer Friendly | Permalink |  | Top
 
Viking12 Donating Member (1000+ posts) Send PM | Profile | Ignore Tue Nov-08-11 06:57 PM
Response to Reply #7
16. False
Edited on Tue Nov-08-11 07:01 PM by Viking12
The BEST data ends in Feb 2010 here are some graphs of that data:

Jan2001-Feb2010


Jan 2000-Feb2010


All BEST data smoothed with 2 different functions


Predicted vs Observed Pre/Post 1998


See also
http://tamino.wordpress.com/2011/11/05/the-real-problem-with-the-global-warming-debate/
Printer Friendly | Permalink |  | Top
 
DesMoinesDem Donating Member (90 posts) Send PM | Profile | Ignore Tue Nov-08-11 07:33 PM
Response to Reply #16
18. No, the BEST data doesn't end if February. That is a lie.
You know why many people don't trust climate science? Because there are people that lie and distort the data to prove their point. You saying that the BEST data ends in February is a flat out lie. And that is easily provable. Now, you can say that data after February should be removed because of uncertainty, but you don't just lie and say it doesn't exist. And then for some reason you choose to post graphs of the last 25 years and 200 years, as if i was questioning warming. I was responding to a post about the last decade. You can take your strawman and lies with you.
Printer Friendly | Permalink |  | Top
 
Viking12 Donating Member (1000+ posts) Send PM | Profile | Ignore Tue Nov-08-11 08:12 PM
Response to Reply #18
19. The data set is online, check for yourself.
Edited on Tue Nov-08-11 08:23 PM by Viking12
There is only global coverage of data through February 2010. All data after that is from less than 50 stations in the Antarctic. It is not just 'uncertain', it is completely useless. By contrast, the previous month list nearly 15000 stations.

http://berkeleyearth.org/data.php

P.S. I'll accept your apology in advance.
Printer Friendly | Permalink |  | Top
 
RaleighNCDUer Donating Member (1000+ posts) Send PM | Profile | Ignore Tue Nov-08-11 01:39 PM
Response to Reply #1
4. But only after spending 20 years denying the changes are happening.
And still, a great many STILL deny it.

It's been a decades long 'yes, but...' argument for them.

Printer Friendly | Permalink |  | Top
 
SCantiGOP Donating Member (1000+ posts) Send PM | Profile | Ignore Tue Nov-08-11 01:38 PM
Response to Original message
3. everytime there is a huge snowstorm
some jackass will roll out the old sarcastic "but I thought we were having climate warming?" No reputable scientist talks of global warming; they refer to global climate change. Some areas get hotter, some colder, some wetter and some dryer, but the overall effect is a slight but real increase in global mean temperature. Just a degree or two is enough to melt polar ice, which then accelerates warming. Anyone who thinks we can dump tons of pollution into the atmosphere and not have it cause a change is a moron.
Printer Friendly | Permalink |  | Top
 
RaleighNCDUer Donating Member (1000+ posts) Send PM | Profile | Ignore Tue Nov-08-11 01:41 PM
Response to Reply #3
5. Tons of pollution into the atmosphere? But...but...
the atmosphere is AIR - it can't possibly hold tons of ANYTHING. Tons are too heavy to be held up by air!

Duh!
Printer Friendly | Permalink |  | Top
 
SheilaT Donating Member (1000+ posts) Send PM | Profile | Ignore Tue Nov-08-11 03:42 PM
Response to Reply #3
12. Plus, warming would lead to more snow, at least initially.
Warmer temps lead to more evaporation, meaning more water in the atmosphere, which means when it does get cold enough the precipitation comes down as . . . you guessed it, snow!
Printer Friendly | Permalink |  | Top
 
DesMoinesDem Donating Member (90 posts) Send PM | Profile | Ignore Tue Nov-08-11 01:54 PM
Response to Original message
6. The record highs for Indiana in early November look like they're all in the 70's and lower 80's
and most of those were in the 1960's and 1970's. So maybe is getting colder. Or maybe you're talking about weather, not climate.
Printer Friendly | Permalink |  | Top
 
Bandit Donating Member (1000+ posts) Send PM | Profile | Ignore Tue Nov-08-11 02:23 PM
Response to Original message
8. There is a difference between weather and Climate
It would seem many people do not understand that ...:shrug:
Printer Friendly | Permalink |  | Top
 
truebrit71 Donating Member (1000+ posts) Send PM | Profile | Ignore Wed Nov-09-11 12:08 PM
Response to Reply #8
26. But you do realize that the weather is impacted by the climate right?
...the two are different, but inter-linked...and one is most definitely an indicator of the other..

One day's freak weather pattern does not = global climate change BUT a trend of increasingly freakish weather patterns most certainly do = global climate change...
Printer Friendly | Permalink |  | Top
 
ProudToBeBlueInRhody Donating Member (1000+ posts) Send PM | Profile | Ignore Wed Nov-09-11 02:50 PM
Response to Reply #26
32. And there are people in this thread......
...pointing to the fact there were in fact days warmer than this 50 years ago.

I'll be honest, I can't recall off the top of my head certain days as warm as it has been the last two or three where I live this time of year....unless it was a holiday or something specifically memorable....but I'm sure they have happened. The pro and anti climate change folks are too busy engaging in anecdotal "Seeeeee....this proves it!" nonsense.
Printer Friendly | Permalink |  | Top
 
Rebubula Donating Member (1000+ posts) Send PM | Profile | Ignore Tue Nov-08-11 02:48 PM
Response to Original message
9. Dear OP
Local weather is NOT the same as global climate.

I grew up in Indiana in the 70s - I certainly remember times just like that.

In fact, looking over weather data from Indiana (http://www.weatherbyday.com/indiana/indianapolis/november-indianapolis-weather.html) - in 1950, the high for November 1 was 81 degrees. The mean high for November is 52. That means there have been plenty of 60+ degree days in November in Indiana.


One year does not an argument make.

The weather argument looks dumb when deniers do it...
Printer Friendly | Permalink |  | Top
 
11 Bravo Donating Member (1000+ posts) Send PM | Profile | Ignore Tue Nov-08-11 03:23 PM
Response to Original message
10. I just finished mowing my lawn in Northern Virginia. Shorts, no shirt, and I was sweating.
Printer Friendly | Permalink |  | Top
 
zbdent Donating Member (1000+ posts) Send PM | Profile | Ignore Tue Nov-08-11 06:48 PM
Response to Original message
14. I've heard callers on the radio pointing out, in Cleveland, in January,
that the fact that someone had snow on the ground in Cleveland in January proves that "global warming" is bullshit ...

Of course, any warm days in November (even those, like today, which are UNSEASONABLY WARM) are because the "warming" is cyclical ... despite the fact that, if you believe that the Earth is only a few thousand years older than Jesus, the "cyclical" argument means that the Earth has been around for far longer than 15K years ... try billions ...
Printer Friendly | Permalink |  | Top
 
dems_rightnow Donating Member (1000+ posts) Send PM | Profile | Ignore Tue Nov-08-11 06:51 PM
Response to Original message
15. If it were 30 degrees...
... would that constitute proof AGAINST climate change?

Didn't think so.
Printer Friendly | Permalink |  | Top
 
RegieRocker Donating Member (1000+ posts) Send PM | Profile | Ignore Wed Nov-09-11 11:48 AM
Response to Original message
25. In 1971 dec 23 it was 72 degrees near st. louis, mo went hiking
In t shirt. Within 1hour it dropped to 36 degrees. It was jogging from then on back to the house.
Printer Friendly | Permalink |  | Top
 
certainot Donating Member (1000+ posts) Send PM | Profile | Ignore Wed Nov-09-11 12:22 PM
Response to Original message
28. radio is a main tool feeding denial and our universities support RW radio by broadcasting sports on
those stations.

limbaugh is king denier and almost singlehandedly made "email gate" a factor, and 15 out of 16 of the NCAA basketball tournament finalists broadcast on limbaugh stations, giving that crap credibility.

get those unis to find alternatives and the main denier tool goes down.
Printer Friendly | Permalink |  | Top
 
yellowcanine Donating Member (1000+ posts) Send PM | Profile | Ignore Wed Nov-09-11 12:22 PM
Response to Original message
29. I am not a denier but this is no indicator of much of anything. Just as snow in October in the
Mid Atlantic isn't either. Don't confuse weather with climate.
Printer Friendly | Permalink |  | Top
 
truebrit71 Donating Member (1000+ posts) Send PM | Profile | Ignore Wed Nov-09-11 03:03 PM
Response to Reply #29
33. You know that the weather is influenced by the climate, right?
Edited on Wed Nov-09-11 03:04 PM by truebrit71
Printer Friendly | Permalink |  | Top
 
yellowcanine Donating Member (1000+ posts) Send PM | Profile | Ignore Wed Nov-09-11 03:21 PM
Response to Reply #33
34. Yes of course. But a specific weather event is a poor indicator of climate change.
What one should do is look at long term patterns. If growing seasons are increasing over time for example (as they are). But that doesn't mean that it won't frost on Sept 30 next year in Florida.
Printer Friendly | Permalink |  | Top
 
truebrit71 Donating Member (1000+ posts) Send PM | Profile | Ignore Wed Nov-09-11 03:46 PM
Response to Reply #34
36. Exactly...but if it is part of an overall trend, then it may very well be an indicator...
..as we've seen major weather events have become more frequent and more damaging the warmer the planet gets...
Printer Friendly | Permalink |  | Top
 
cleanhippie Donating Member (1000+ posts) Send PM | Profile | Ignore Wed Nov-09-11 03:24 PM
Response to Original message
35. Thats about as asinine a statement as when deniers state "Its snowing in May, explain that!"
:banghead:
Printer Friendly | Permalink |  | Top
 
DU AdBot (1000+ posts) Click to send private message to this author Click to view 
this author's profile Click to add 
this author to your buddy list Click to add 
this author to your Ignore list Tue Apr 30th 2024, 03:23 PM
Response to Original message
Advertisements [?]
 Top

Home » Discuss » General Discussion Donate to DU

Powered by DCForum+ Version 1.1 Copyright 1997-2002 DCScripts.com
Software has been extensively modified by the DU administrators


Important Notices: By participating on this discussion board, visitors agree to abide by the rules outlined on our Rules page. Messages posted on the Democratic Underground Discussion Forums are the opinions of the individuals who post them, and do not necessarily represent the opinions of Democratic Underground, LLC.

Home  |  Discussion Forums  |  Journals |  Store  |  Donate

About DU  |  Contact Us  |  Privacy Policy

Got a message for Democratic Underground? Click here to send us a message.

© 2001 - 2011 Democratic Underground, LLC