| Latest | Greatest | Lobby | Journals | Search | Options | Help | Login |
|
|
|
This topic is archived. |
| Home » Discuss » Archives » General Discussion (1/22-2007 thru 12/14/2010) |
|
| StopTheNeoCons
|
Sun Mar-01-09 10:01 PM Original message |
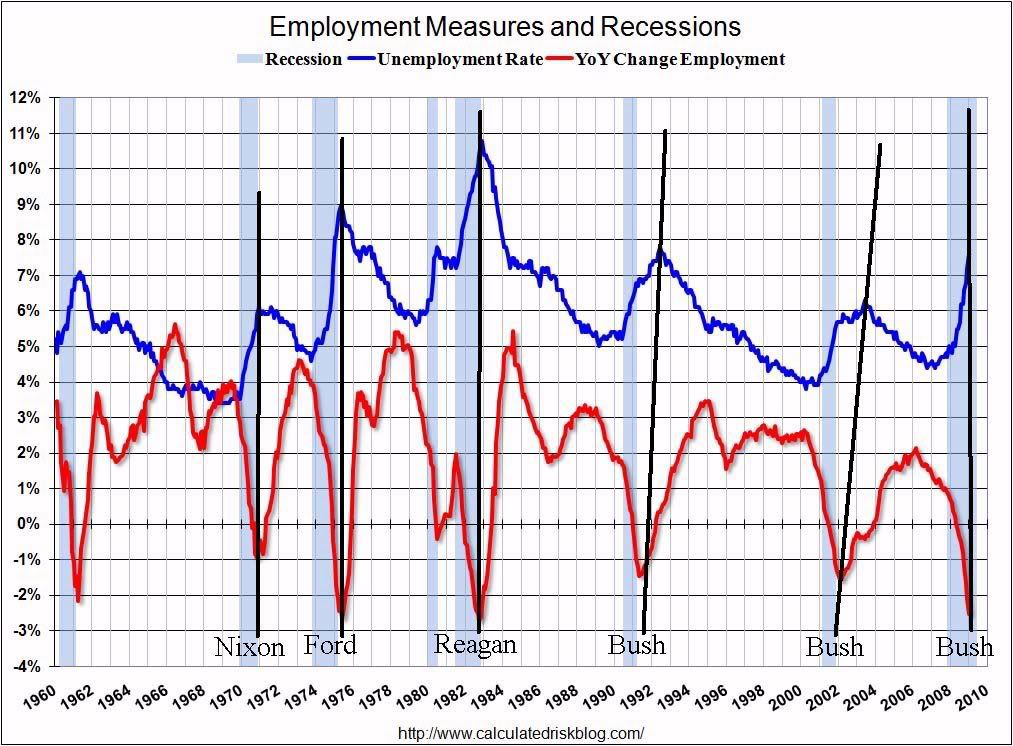
| See all the rethug recessions here |
| Printer Friendly | Permalink | | Top |
| opihimoimoi
|
Sun Mar-01-09 10:04 PM Response to Original message |
| 1. Truly Embarrassing and Appalling as well.....This needs to be put out there |
| Printer Friendly | Permalink | | Top |
| virgogal
|
Sun Mar-01-09 10:09 PM Response to Original message |
| 2. Looks like JFK was involved in a big dip also. Not a very |
| Printer Friendly | Permalink | | Top |
| StopTheNeoCons
|
Sun Mar-01-09 10:14 PM Response to Reply #2 |
| 3. you must be a rethug to miss seeing the truth shown above |
| Printer Friendly | Permalink | | Top |
| achtung_circus
|
Sun Mar-01-09 10:24 PM Response to Reply #3 |
| 6. Close to a call-out- and |
| Printer Friendly | Permalink | | Top |
| spanone
|
Sun Mar-01-09 10:16 PM Response to Reply #2 |
| 4. 6 republics to one democrat.... |
| Printer Friendly | Permalink | | Top |
| Still Sensible
|
Sun Mar-01-09 10:23 PM Response to Reply #2 |
| 5. Looks like that one started under Ike |
| Printer Friendly | Permalink | | Top |
| DU
AdBot (1000+ posts) |
Tue Apr 30th 2024, 02:50 PM Response to Original message |
| Advertisements [?] |
| Top |
| Home » Discuss » Archives » General Discussion (1/22-2007 thru 12/14/2010) |
|
Powered by DCForum+ Version 1.1 Copyright 1997-2002 DCScripts.com
Software has been extensively modified by the DU administrators
Important Notices: By participating on this discussion board, visitors agree to abide by the rules outlined on our Rules page. Messages posted on the Democratic Underground Discussion Forums are the opinions of the individuals who post them, and do not necessarily represent the opinions of Democratic Underground, LLC.
Home | Discussion Forums | Journals | Store | Donate
About DU | Contact Us | Privacy Policy
Got a message for Democratic Underground? Click here to send us a message.
© 2001 - 2011 Democratic Underground, LLC
 ">
">