MODS: Press release.
February 2, 2011
Arctic Oscillation brings record low January extent, unusual mid-latitude weather
Arctic sea ice extent for January 2011 was the lowest in the satellite record for that month. The Arctic oscillation persisted in its strong negative phase for most of the month, keeping ice extent low.
Overview of conditions
Arctic sea ice extent averaged over January 2011 was 13.55 million square kilometers (5.23 million square miles). This was the lowest January ice extent recorded since satellite records began in 1979. It was 50,000 square kilometers (19,300 square miles) below the record low of 13.60 million square kilometers (5.25 million square miles), set in 2006, and 1.27 million square kilometers (490,000 square miles) below the 1979 to 2000 average.
Ice extent in January 2011 remained unusually low in Hudson Bay, Hudson Strait (between southern Baffin Island and Labrador), and Davis Strait (between Baffin Island and Greenland). Normally, these areas freeze over by late November, but this year Hudson Bay did not completely freeze over until mid-January. The Labrador Sea remains largely ice-free.
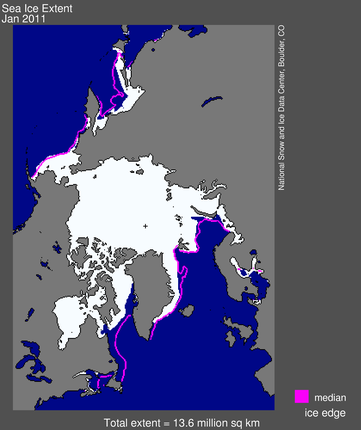
Figure 1. Arctic sea ice extent for January 2011 was 13.55 million square kilometers (5.23 million square miles). The magenta line shows the 1979 to 2000 median extent for that month. The black cross indicates the geographic North Pole.
Conditions in context
Air temperatures over much of the Arctic were 2 to 6 degrees Celsius (4 to 11 degrees Fahrenheit) above normal in January. Over the eastern Canadian Arctic Archipelago, Baffin Bay/Davis Strait and Labrador Sea, temperatures were at least 6 degrees Celsius (11 degrees Fahrenheit) higher than average. Temperatures were near average over the western Canadian Arctic Archipelago and Scandinavia.
As in December 2010, the warm temperatures in January came from two sources: unfrozen areas of the ocean continued to release heat to the atmosphere, and the wind patterns accompanying the negative phase of the Arctic oscillation brought warm air into the Arctic. Near the end of January the negative Arctic oscillation pattern broke down and turned positive, which usually favors ice growth. It is unclear how long it will remain in a positive mode.
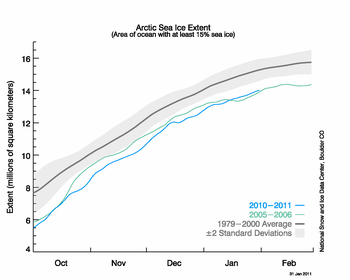
Figure 2. The graph above shows daily Arctic sea ice extent as of January 31, 2011, along with daily ice extents for previous low-ice-extent years in the month of January. Light blue indicates 2010-2011, green shows 2005-2006 (the record low for the month was in 2006), and dark gray shows the 1979 to 2000 average. The gray area around the average line shows the two standard deviation range of the data.
January 2011 compared to past years
January 2011 had the lowest ice extent for the month since the beginning of satellite records. The linear rate of decline for the month is �3.3% per decade.
Ice extent for the Arctic as a whole increased at an average of 42,800 square kilometers (16,500 square miles) per day through the month of January, which is about average.
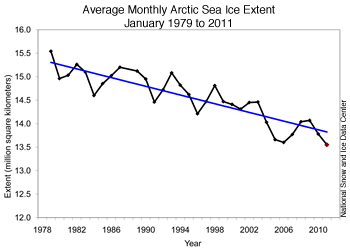
Figure 3. Monthly January ice extent for 1979 to 2011 shows a decline of 3.3% per decade.
Slow regional ice growth
In contrast, regional ice growth has been particularly slow compared to past years. Hudson Bay did not completely freeze up until mid-January, about a month later than normal according to Canadian Ice Service analyses. The Labrador Sea region is still largely free of ice, except in protected bays along the coast. Normally at this time of year, ice extends a few hundred kilometers from the coast all the way from Hudson Strait to Newfoundland.
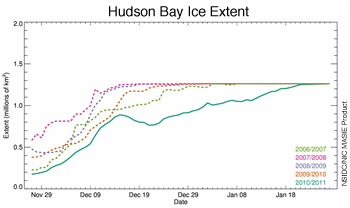
Figure 4. This graph shows the ice extent in Hudson Bay from late November to the end of January, for the last five years. This year, Hudson Bay froze up substantially later than in previous years.
EDIT
EDIT
http://nsidc.org/arcticseaicenews/index.html