Democratic Underground Latest Greatest Lobby Journals Search Options Help Login
Google

Place Your Bets! NSIDC Calls Arctic Sea Ice Maximum For Year 3/31/10

Printer-friendly format Printer-friendly format
Printer-friendly format Email this thread to a friend
Printer-friendly format Bookmark this thread
This topic is archived.
Home » Discuss » Topic Forums » Environment/Energy Donate to DU
 
hatrack Donating Member (1000+ posts) Send PM | Profile | Ignore Wed Apr-07-10 12:32 PM
Original message
Place Your Bets! NSIDC Calls Arctic Sea Ice Maximum For Year 3/31/10
Edited on Wed Apr-07-10 12:33 PM by hatrack
April 6, 2010
Cold snap causes late-season growth spurt


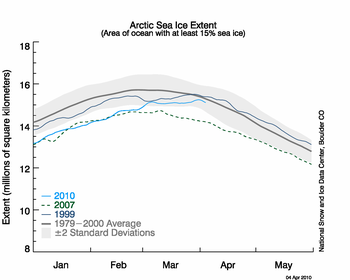
Arctic sea ice reached its maximum extent for the year on March 31 at 15.25 million square kilometers (5.89 million square miles). This was the latest date for the maximum Arctic sea ice extent since the start of the satellite record in 1979.

Early in March, Arctic sea ice appeared to reach a maximum extent. However, after a short decline, the ice continued to grow. By the end of March, total extent approached 1979 to 2000 average levels for this time of year. The late-season growth was driven mainly by cold weather and winds from the north over the Bering and Barents Seas. Meanwhile, temperatures over the central Arctic Ocean remained above normal and the winter ice cover remained young and thin compared to earlier years.

Overview of conditions

Arctic sea ice extent averaged for March 2010 was 15.10 million square kilometers (5.83 million square miles). This was 650,000 square kilometers (250,000 square miles) below the 1979 to 2000 average for March, but 670,000 square kilometers (260,000 square miles) above the record low for the month, which occurred in March 2006.

Ice extent was above normal in the Bering Sea and Baltic Sea, but remained below normal over much of the Atlantic sector of the Arctic, including the Baffin Bay, and the Canadian Maritime Provinces seaboard. Extent in other regions was near average.


March 2010 compared to past years

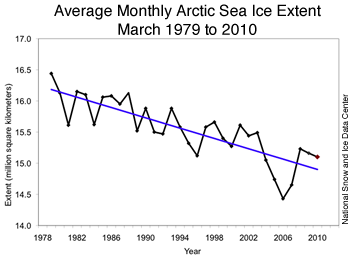
The average ice extent for March 2010 was 670,000 square kilometers (260,000 square miles) higher than the record low for March, observed in 2006. The linear rate of decline for March over the 1978 to 2010 period is 2.6% per decade.


EDIT

http://nsidc.org/arcticseaicenews/2010/040610.html
Printer Friendly | Permalink |  | Top
RaleighNCDUer Donating Member (1000+ posts) Send PM | Profile | Ignore Wed Apr-07-10 01:14 PM
Response to Original message
1. The anti-global warming apologist on Colbert mentioned this last night
and I was pissed that the climatologist didn't call him on it - the extent of the ice approached previous levels, but the ice was HALF as thick as it was when it previously reached that extent. That means it will melt all the faster this summer. Despite what he would have us believe, we are still in a warming and melting trend.
Printer Friendly | Permalink |  | Top
 
XemaSab Donating Member (1000+ posts) Send PM | Profile | Ignore Wed Apr-07-10 04:13 PM
Response to Original message
2. That top graph is very interesting
It looks like a complete phase shift from the average.
Printer Friendly | Permalink |  | Top
 
joshcryer Donating Member (1000+ posts) Send PM | Profile | Ignore Wed Apr-07-10 06:34 PM
Response to Original message
3. $10 that we go below 12.5 million square km.
Printer Friendly | Permalink |  | Top
 
pscot Donating Member (1000+ posts) Send PM | Profile | Ignore Wed Apr-07-10 10:07 PM
Response to Original message
4. Could the Chinese dust storms
be having a cooling effect? Since early March huge clouds of dust have been blowing east across China. In Beijing recently, visibility was less than 50 yards and the dust has been obscuring the sun from Taipei to Vladivostok. El Nino usually dries out the Pacific Northwest, but this spring has been unusually cold and wet, with one storm after another moving through; weather more typically seen in November. Currently there seems to be cloud cover over most of the north Pacific. I think there's a research project in there somewhere.
Printer Friendly | Permalink |  | Top
 
phantom power Donating Member (1000+ posts) Send PM | Profile | Ignore Thu Apr-08-10 10:45 AM
Response to Original message
5. It's a shame we haven't been able to track total volume over time.
It would be a more illuminating plot.
Printer Friendly | Permalink |  | Top
 
DU AdBot (1000+ posts) Click to send private message to this author Click to view 
this author's profile Click to add 
this author to your buddy list Click to add 
this author to your Ignore list Tue May 07th 2024, 03:10 PM
Response to Original message
Advertisements [?]
 Top

Home » Discuss » Topic Forums » Environment/Energy Donate to DU

Powered by DCForum+ Version 1.1 Copyright 1997-2002 DCScripts.com
Software has been extensively modified by the DU administrators


Important Notices: By participating on this discussion board, visitors agree to abide by the rules outlined on our Rules page. Messages posted on the Democratic Underground Discussion Forums are the opinions of the individuals who post them, and do not necessarily represent the opinions of Democratic Underground, LLC.

Home  |  Discussion Forums  |  Journals |  Store  |  Donate

About DU  |  Contact Us  |  Privacy Policy

Got a message for Democratic Underground? Click here to send us a message.

© 2001 - 2011 Democratic Underground, LLC