March 3, 2010
Double-dip Arctic Oscillation, and update on Antarctica
In February, Arctic sea ice extent continued to track below the average, and near the levels observed for February 2007. Ice extent was unusually low in the Atlantic sector of the Arctic, and above normal in the Bering Sea. Meanwhile, Antarctic sea ice reached its summer minimum, near the average for 1979 to 2000.
Overview of conditions
Arctic sea ice extent averaged for February 2010 was 14.58 million square kilometers (5.63 million square miles). This was 1.06 million square kilometers (409,000 square miles) below the 1979 to 2000 average for February, but 220,000 square kilometers (85,000 square miles) above the record low for the month, which occurred in February 2005.
Ice extent was above normal in the Bering Sea, but remained below normal over much of the Atlantic sector of the Arctic, including the Barents Sea, part of the East Greenland Sea, and in Davis Strait.
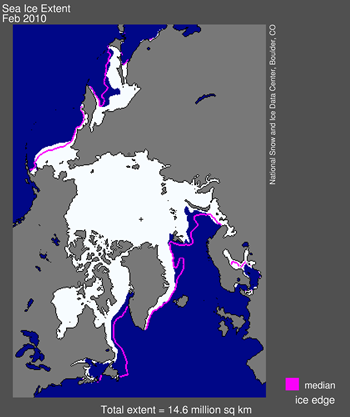
Figure 1. Arctic sea ice extent for February 2010 was 14.58 million square kilometers (5.63 million square miles). The magenta line shows the 1979 to 2000 median extent for that month. The black cross indicates the geographic North Pole. Sea Ice Index data. About the data.
Conditions in context
During February 2010, ice extent grew at an average of 25,700 square kilometers (9,900 square miles) per day. Sea ice extent increased at a fairly steady rate in the early part of the month and then slowed after the middle of February. Ice extent remained more than two standard deviations below the 1979 to 2000 average throughout the month.
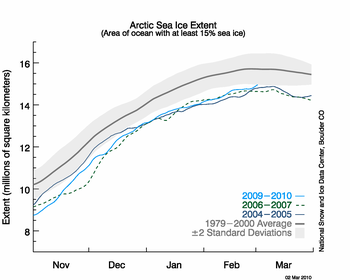
Figure 2. The graph above shows daily sea ice extent as of March 2, 2010. The solid light blue line indicates 2009/2010; dashed green indicates 2006/2007; dark blue shows 2004/2005 (the record low for the month of February); and solid gray indicates average extent from 1979 to 2000. The gray area around the average line shows the two standard deviation range of the data.
February 2010 compared to past years
The average ice extent for February 2010 was the fourth lowest February extent since the beginning of the modern satellite record. It was 220,000 square kilometers (85,000 square miles) higher than the record low for February, observed in 2005. The linear rate of decline for February is now 2.9% per decade.
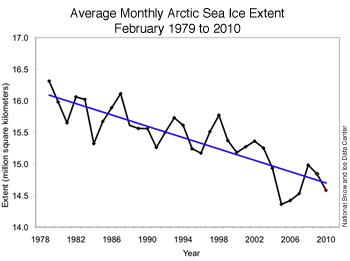
Figure 3. Monthly February ice extent for 1979 to 2010 shows a decline of 2.9% per decade.
Double-dip Arctic Oscillation
As noted previously, the Arctic Oscillation has been extremely negative this winter, with unusually high surface pressure over the Arctic Ocean. Following a strong negative phase from mid-December through mid-January, the AO briefly went positive, but then dipped again to a strongly negative phase. For more information on the Arctic Oscillation, see the NOAA Climate Prediction Center Web site.
The strong negative AO has contributed to cold temperatures throughout much of the U.S. and northern Europe, and the notable snow events in the eastern U.S. However, the impact on the Arctic has been quite different. First, a negative AO tends to bring warmer than normal temperatures to the Arctic. This factor contributed to the low ice conditions in the Atlantic side of the Arctic, discussed above. Second, the AO has a strong effect on Arctic sea ice motion. The pattern of winds associated with a strongly negative AO tends to reduce export of ice out of the Arctic through the Fram Strait. This helps keep more of the older, thicker ice within the Arctic. While little old ice remains, sequestering what is left may help keep the September extent from dropping as low as it did in the last few years. Much will depend on the weather patterns that set up this spring and summer.
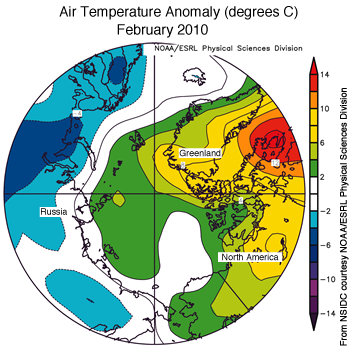
Figure 4. Map of air temperature anomalies for February 2010, at the 925 millibar level (roughly 1,000 meters or 3,000 feet above the surface) shows warmer than usual temperatures over the Arctic Ocean, with especially warm temperatures over Eastern Canada. Areas in orange and red correspond to strong positive (warm) anomalies. Areas in blue and purple correspond to negative (cool) anomalies.
Ice conditions off the Canadian east coast
Tom Agnew, Stephen Howell, and Lionel Hache of Environment Canada note that average ice conditions off the east coast of Canada were at record lows during the first three weeks of February. Sea ice charts prepared by the Canadian Ice Service show that ice coverage in the Labrador Sea and Gulf of St. Lawrence was the lowest for that time period since analysts started charting the region in 1969. Mild temperatures and predominately northeasterly winds have prevented both the advance of ice down the Labrador coast and the formation of ice in the Gulf of St. Lawrence. These ice conditions are also linked to the strong negative Arctic Oscillation pattern.
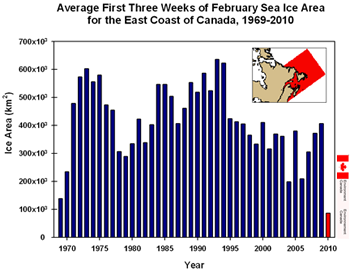
Figure 5. The blue bars represent the average sea ice area on Canada's east coast for the first three weeks of February, from 1969 to 209. The red bar shows the sea ice area for the same period in 2010.
A brief look at Antarctic sea ice
While our analysis focuses on Arctic sea ice, we note that Antarctic sea ice has reached its summer minimum extent for the year, at 2.87 million square kilometers (1.11 million square miles). This was 88,500 square kilometers above the 1979 to 2000 average minimum. Through the austral summer, the total extent of sea ice surrounding the Antarctic continent has remained within two standard deviations of the 1979 to 2000 average.
Sea ice extent in the Antarctic has been unusually high in recent years, both in summer and winter. Overall, the Antarctic is showing small positive trends in total extent. For example, the trend in February extent is now +3.1% per decade. However, the Amundsen and Bellingshausen Seas show a strong negative trend in extent. These overall positive trends may seem counterintuitive in light of what is happening in the Arctic. Our Frequently Asked Questions section briefly explains the general differences between the two polar environments. A recent report (Turner, et. al., 2009) suggests that the ozone hole has resulted in changes in atmospheric circulation leading to cooling and increasing sea ice extents over much of the Antarctic region.
For data on Antarctic sea ice, see the NSIDC Sea Ice Index.
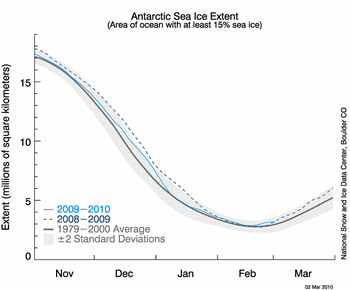
Figure 6. The graph above shows daily Antarctic sea ice extent as of March 2, 2010. The solid light blue line indicates 2009/2010; dashed dark blue indicates 2008/2009; and solid gray indicates average extent from 1979 to 2000. The gray area around the average line shows the two standard deviation range of the data.
EDIT/END
http://nsidc.org/arcticseaicenews/index.html