Mods: Press release.
December 7, 2009
Low ice extent in Barents Sea and Hudson Bay
In November, the average rate of Arctic sea ice growth slightly exceeded the 1979 to 2000 average growth rate for the month. However, at the end of the month, some regions, in particular the Barents Sea and Hudson Bay, still had much less ice cover than normal.
Overview of conditions
Arctic sea ice extent averaged over November 2009 was 10.26 million square kilometers (3.96 million square miles). This was 1.05 million square kilometers (405,000 square miles) below the 1979 to 2000 average for November, but 420,000 square kilometers (160,000 square miles) above the record low for the month, which occurred in November 2006. In general, the ice edge is now at or slightly beyond its average location, with two notable exceptions: Hudson Bay and the Barents Sea.
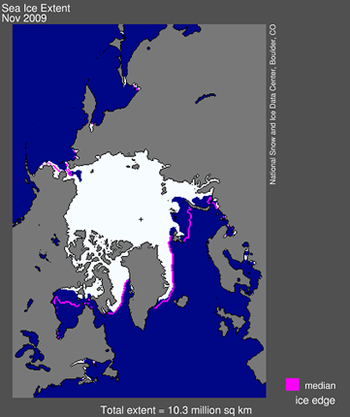
Figure 1. Arctic sea ice extent for November 2009 was 10.26 million square kilometers (3.96 million square miles). The magenta line shows the 1979 to 2000 median extent for that month. The black cross indicates the geographic North Pole.
Conditions in context
By November, much of the Arctic is in complete or near complete darkness. Air temperatures fall dramatically and sea ice grows rapidly. During November 2009, extent grew at an average 82,000 square kilometers per day (32,000 square miles per day). The rate of increase in sea ice extent was slower during the first half of November, and faster during the latter half.
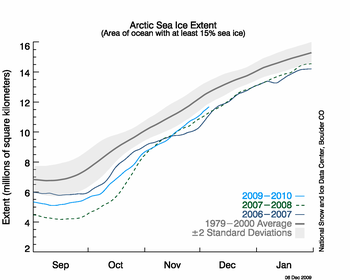
Figure 2. The graph above shows daily sea ice extent as of December 6, 2009. The solid light blue line indicates 2009; dark blue shows 2006, dashed green indicates 2007; and solid gray indicates average extent from 1979 to 2000. The gray area around the average line shows the two standard deviation range of the data.
November 2009 compared to past years
November 2009 had the third-lowest average extent for the month since the beginning of satellite records. The linear rate of decline for the month is now 4.5 percent per decade.
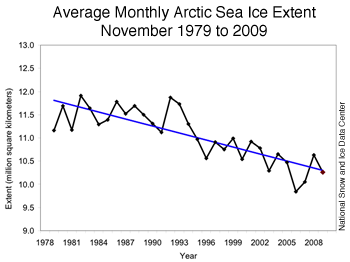
Figure 3. Monthly November ice extent for 1979 to 2009 shows a decline of 4.5% per decade.
Slow ice growth: a tale of two regions
Both Hudson Bay and the Barents Sea have experienced a slow freeze-up this fall. However, the slow sea ice growth in the two regions probably resulted from different processes, highlighting the complex interactions between the sea ice, atmosphere and ocean. In the Barents Sea, ice growth was slowed by winds that pushed the ice northwards into the central Arctic, while warmer-than-usual temperatures contributed to the slow ice growth in Hudson Bay.
The Barents Sea is the deepest of the Arctic coastal seas. It is open on its southern and northern boundaries, allowing winds and currents to move sea ice in and out of the region. In November, southerly winds built up between an area of high pressure over Siberia and low pressure in the northern Atlantic Ocean, in accordance with Buys Ballot's Law. The winds transported warm air and water from the south, and pushed the ice edge northwards out of the Barents Sea.
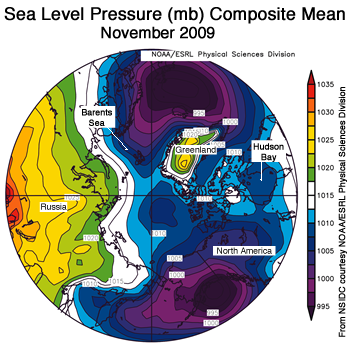
Figure 4. The map of sea level pressure (in millibars) for November 2009, shows low pressure in the North Atlantic and high pressure over Russia, which led to winds that brought warmth to the Barents Sea and pushed the ice northward.
In contrast to the Barents Sea, Hudson Bay is a relatively shallow body of water, largely enclosed by land. Ocean waters and sea ice do not flow easily in or out of the bay. The lack of ice in southern Hudson Bay this November is probably related to warmer than normal air temperatures in the region, particularly during the first half of the month.
Air temperatures over Barents Sea were also high during November. While the southerly winds contributed to the warmth, ice-free conditions in the Barents likely also added to the atmospheric heat. Without an insulating cover of sea ice, the ocean releases heat directly to the air.
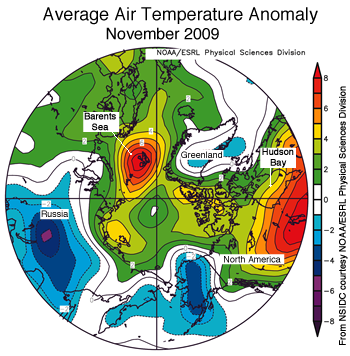
Figure 5. The map of air temperature anomalies for November 2009, at the 925 millibar level (roughly 1,000 meters <3,000 feet> above the surface), shows warmer than usual temperatures over the Barents Sea and Hudson Bay. Areas in blue correspond to negative (cool) anomalies. Areas in orange and red correspond to strong positive (warm) anomalies.
EDIT/END
http://nsidc.org/arcticseaicenews/index.html