Democratic Underground Latest Greatest Lobby Journals Search Options Help Login
Google

Chart of the Day: Americans' Stagnant (and Falling) Disposable Incomes

Printer-friendly format Printer-friendly format
Printer-friendly format Email this thread to a friend
Printer-friendly format Bookmark this thread
Home » Discuss » Editorials & Other Articles Donate to DU
 
xchrom Donating Member (1000+ posts) Send PM | Profile | Ignore Sun Oct-30-11 09:28 AM
Original message
Chart of the Day: Americans' Stagnant (and Falling) Disposable Incomes
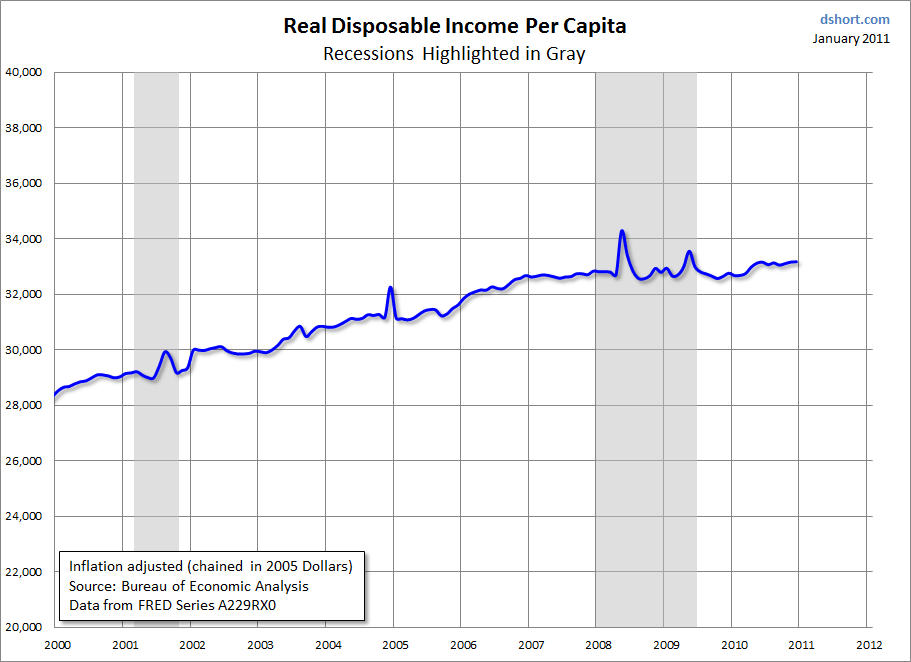
http://www.theatlantic.com/business/archive/2011/10/chart-of-the-day-americans-stagnant-and-falling-disposable-incomes/247551/

Still basking in the afterglow of the best report for U.S. growth in a year, economists did not make a big deal out of another report that the Bureau of Economic Analysis released on Friday. The monthly report on personal income, spending, and saving is hardly as sexy as GDP, but it can provide an even better gauge for how Americans might be feeling. If saving and incomes are both up, then they're probably concerned. If incomes are down, then they're probably miserable. The report reveals a rather disturbing fact: inflation-adjusted disposable income per capita is slightly below September 2006 levels.

Check out this sobering chart:


Since July, real disposable incomes have been declining. Although the decline in September was modest, it still helps to explain why consumers are so gloomy: their disposable incomes have been falling over the past three months.

Really, they had been virtually stagnant all year leading up to July too. The income growth we saw from late-2009 through mid-2010 sort of just stopped. Now it has reversed. The September value was the lowest since April 2010. Prior to the recession, disposable income per capita hit and blew past its September 2011 level in September 2006.
Refresh | +3 Recommendations Printer Friendly | Permalink | Reply | Top
sam11111 Donating Member (638 posts) Send PM | Profile | Ignore Sun Oct-30-11 10:10 AM
Response to Original message
1. chart since longer timeframe available? like 1925? or 1980?
Even better

Discressionary..for just the middle and lower class
Printer Friendly | Permalink | Reply | Top
 
bhikkhu Donating Member (1000+ posts) Send PM | Profile | Ignore Sun Oct-30-11 12:42 PM
Response to Reply #1
2. Here's two, going back to 2000, and to 1960:
Printer Friendly | Permalink | Reply | Top
 
DU AdBot (1000+ posts) Click to send private message to this author Click to view 
this author's profile Click to add 
this author to your buddy list Click to add 
this author to your Ignore list Mon Apr 29th 2024, 11:20 PM
Response to Original message
Advertisements [?]
 Top

Home » Discuss » Editorials & Other Articles Donate to DU

Powered by DCForum+ Version 1.1 Copyright 1997-2002 DCScripts.com
Software has been extensively modified by the DU administrators


Important Notices: By participating on this discussion board, visitors agree to abide by the rules outlined on our Rules page. Messages posted on the Democratic Underground Discussion Forums are the opinions of the individuals who post them, and do not necessarily represent the opinions of Democratic Underground, LLC.

Home  |  Discussion Forums  |  Journals |  Store  |  Donate

About DU  |  Contact Us  |  Privacy Policy

Got a message for Democratic Underground? Click here to send us a message.

© 2001 - 2011 Democratic Underground, LLC