Environment & Energy
Related: About this forumThe E/E pocket reference guide
Last edited Tue Feb 5, 2019, 10:20 PM - Edit history (21)
E/E invites discussion or any subject pertaining to the environment (biodiversity, pollution, GM crops, population et al); energy (fossil fuels, renewables, and the great nuclear pie-fight); and of course climate change/resource use which links the two. Peak oil related posts are also welcome, but don't forget the peak oil group.
If you've got questions about climate change feel free to ask, but if you repeatedly post denialist rubbish you are liable to be shown the door...
Updating Feb 2019 (Sorry for the wait. I've been tired and shagged out following a prolonged squawk).
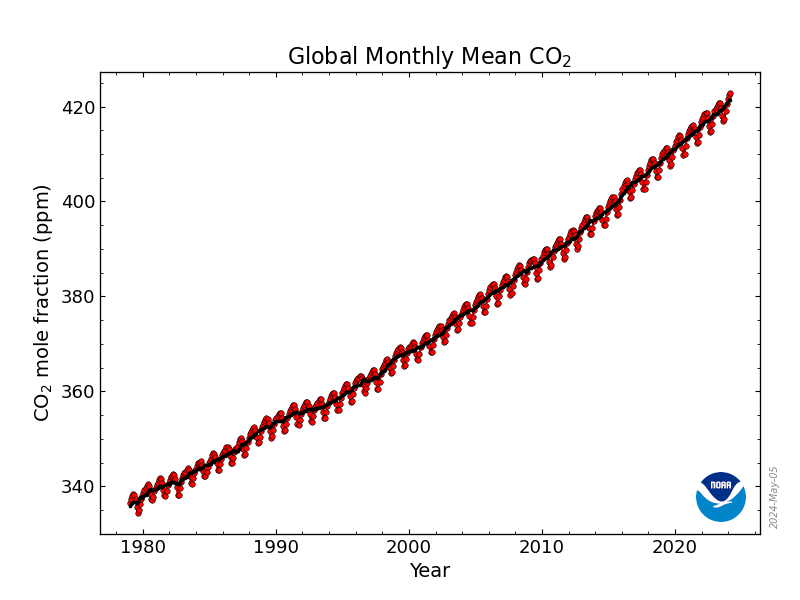
Carbon Dioxide
Carbon dioxide ( CO₂ ) is the GHG that gets discussed the most, because of the sheer amount we produce (9 billion tons in 2010) and because so much of our existing energy produces it. The best guess for a sustainable level is 350 ppm, so... Yeah. Good luck with that.
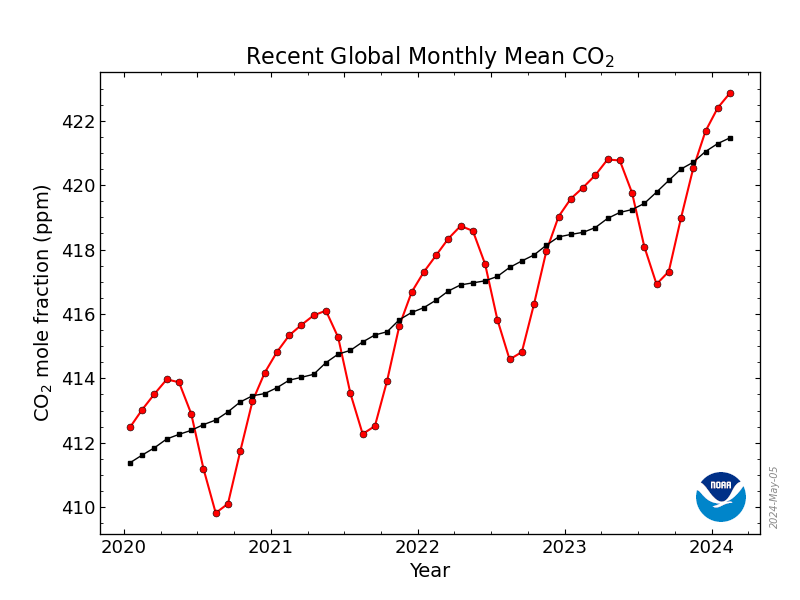
Short term trend (Source: NOAA):
Long term trend (Source: NOAA):
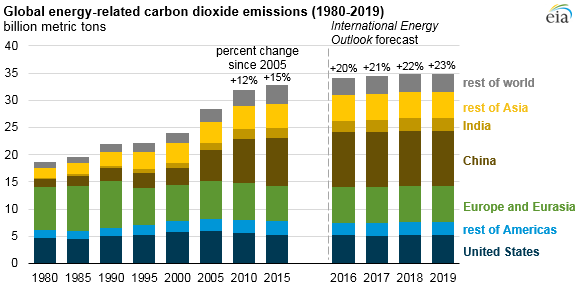
Emissions by region (Source: EIA):
Emissions by sector (Source: OWID)

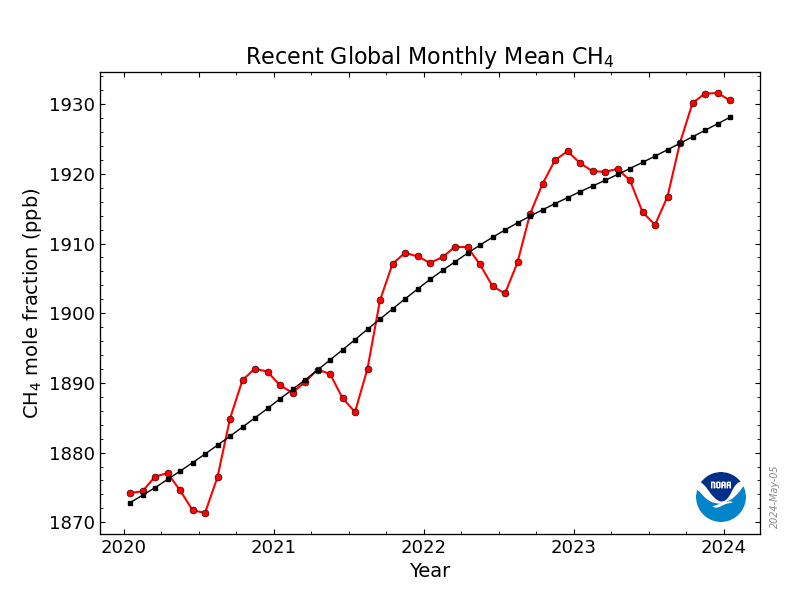
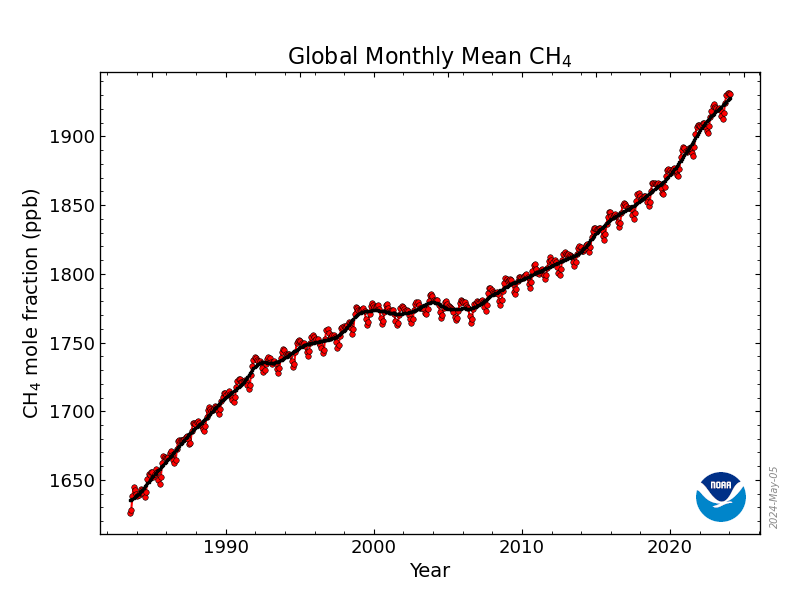
Methane
Methane ( CH₄ ) is a hundred times more potent (by mass) than CO₂ over a 20 year period: Although it does break down over time, the total amount in the atmosphere is increasing, largely due to melting clathrates in the oceans and permafront.
Short term trend (Source: NOAA)
Long term trend (Source: NOAA)
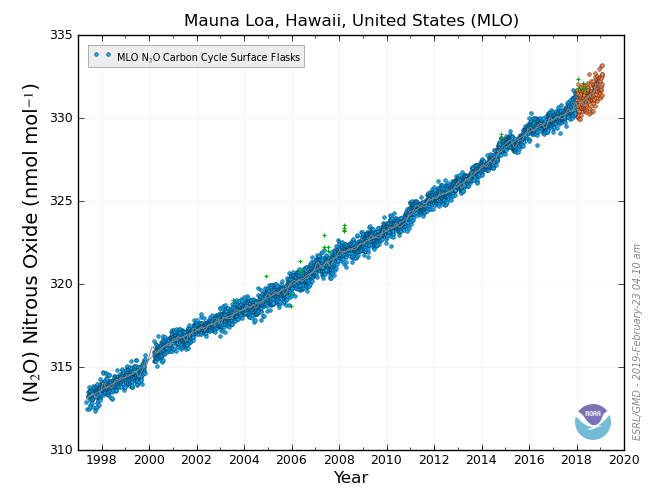
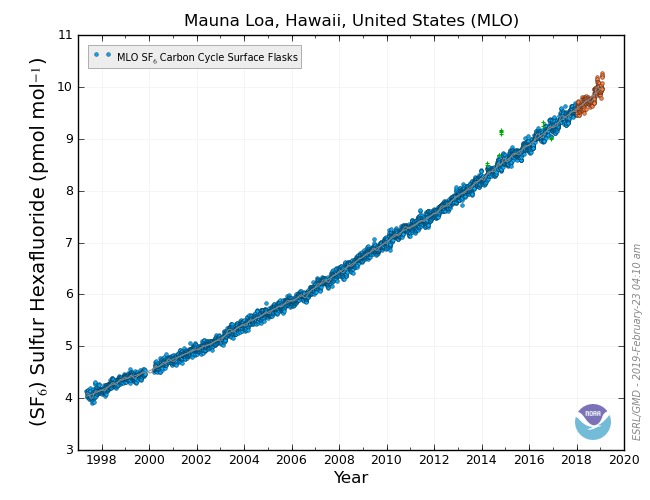
Other GHGs
Nitrous Oxide (Source: NOAA)
N₂O is mainly released from fertilizer, is about 200 times more potent than CO₂, with a lifetime of ~120 years.
Sulfur Hexafluoride (Source: NOAA)
SF₆ is used in industry, is about 36,000 times more potent than CO₂, with a lifetime of ~6,000 years.
Current(ish) Temperature Anomalies:
Surface temperature (Source: NASA)

Ocean Heat Content (Source: NOAA)

The 'Hockey stick':
Source: The OSS Foundation
There are various versions of this chart: This is the from the last IPCC report, but there are more (with comparisons) at the link.
[div style="clear:both"]
[div style="width: 60%; float:right"] 
Realism vs Skepticism:
Source: Skeptical Science
Pwnd. Also check out Rasmus Benestad's trend-fudging masterclass at RealClimate.
[div style="clear:both"]
[div id="sechyd"][font size=4 ]Hydrology[/font]
[div style="width: 60%; float:right"] 
US Drought:
Source: UNL
[div style="clear:both"]
[div style="width: 60%; float:right"] 
Arctic ice area:
Source: UIUC
[div style="clear:both"]
[div style="width: 60%; float:right"] 
Arctic ice mass (PIOMAS):
Source: WashingtonU
[div style="clear:both"]
[div style="width: 60%; float:right"] 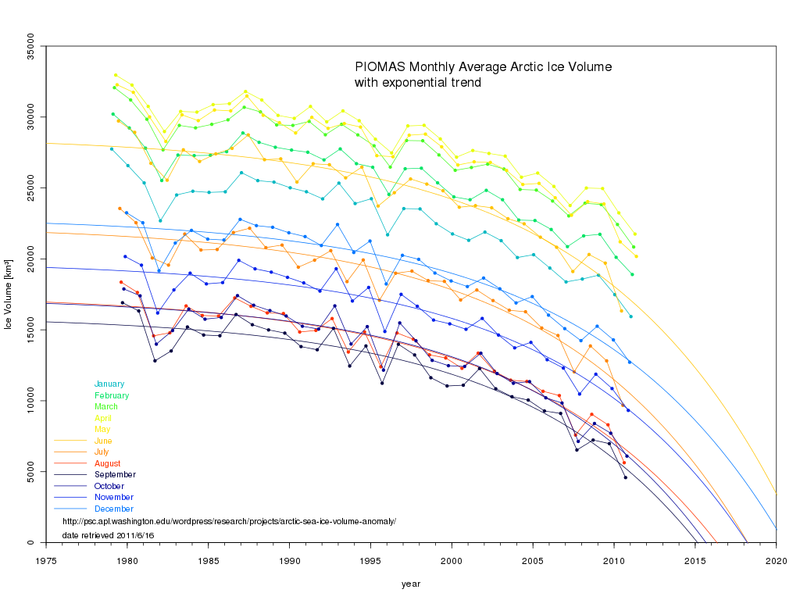
PIOMAS trends:
Source: Neven
Neven's Plot'o'Doom. Not guaranteed, but certainly food for thought.
[div style="clear:both"]
[div style="width: 60%; float:right"] 
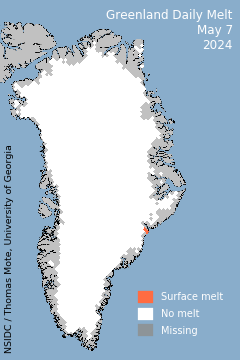
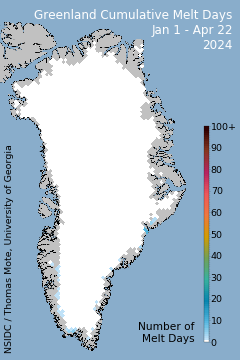
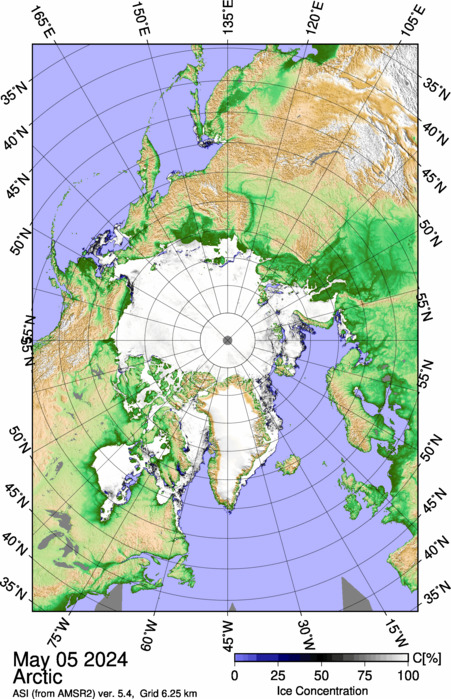
Arctic ice map:
Source: UIUC
[div style="clear:both"]
[div style="width: 60%; float:right"] 
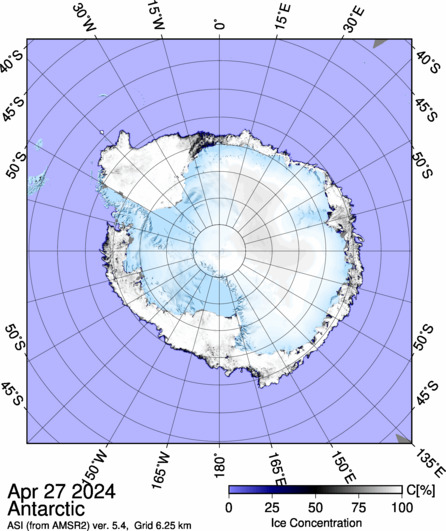
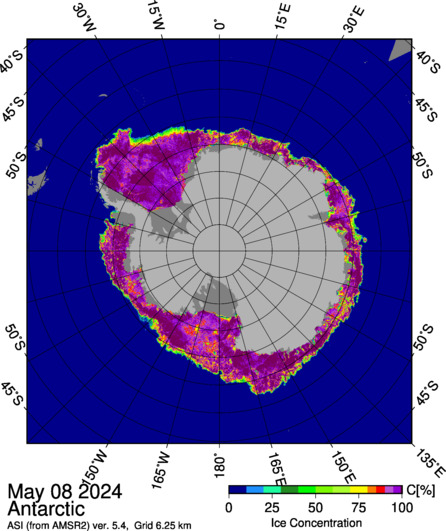
Antarctic ice map:
Source: UIUC
[div style="clear:both"]
[div id="secpal"][font size=4 ]Paleoclimate[/font]
[div style="width: 60%; float:right"] 
CO2 & Temp for 5 glaciations
Source: GWArt
[div style="clear:both"]
[div style="width: 60%; float:right"] 
Milankovitch cycles
Source: GWArt
NB: Recent is on the left.
[div style="clear:both"]
[div style="width: 60%; float:right"] 
CO2 & Temp for 4 glaciations
Source: VictoriaU
NB: Recent is on the left.
[div style="clear:both"]
[div id="secene"][font size=4 ]Energy[/font]
[div style="width: 60%; float:right"] 
US Energy flowchart - 2010
Source: LLNL
[div style="clear:both"]
[div style="width: 60%; float:right"] 
Global energy production - 1985 to 2010
Source: Consumer Energy Report
NB: The figures are from BP, but I assume they're accurate.
[div style="clear:both"]
[div style="width: 60%; float:right"]

Energy consumption by fuel - 1990 to 2035
Source: EIA
Many more at the link.
[div style="clear:both"]
[div id="secres"][font size=4 ]Responses to denialist claptrap[/font]
Claim: CO2 followed warming after the last ice age.
[div style="width: 60%; float:right"] 
Details: Rather than an increase in CO2 causing increasing temperatures at the end of the last ice, the increase in CO2 was caused by increasing temperatures. Therefore, we don't need to worry about increasing CO2 now.
Response: A test of 80 temperature proxies referenced against CO2 levels (from air trapped in ice) shows that the the CO2 definitely came first. A fuller explanation can be found at http://www.livescience.com/19481-ice-age-carbon-dioxide-orbit.html, and the paper is at http://www.nature.com/nature/journal/v484/n7392/full/nature10915.html
[div style="clear:both"]
(I'll add more of these next week 

[div id="seclin"][font size=4 ]Links[/font]
RealClimate: Climate Science from climate scientists.
Skeptical Science: Examines the science and arguments of global warming skepticism.
The Oil Drum: Discussions about Energy and Our Future
Nevan's ice blog.
GliderGuider's happy fun pages.
[div style="width: 60%; float:left"] 
[div style="clear:both"]
 = new reply since forum marked as read
Highlight:
NoneDon't highlight anything
5 newestHighlight 5 most recent replies
= new reply since forum marked as read
Highlight:
NoneDon't highlight anything
5 newestHighlight 5 most recent replies

Nederland
(9,976 posts)How about a temperature graph that shows a slightly longer time period, like this one:
Or perhaps this one:
I'm sorry, am I off message? 

Dead_Parrot
(14,478 posts)Let me fix it for you:

from http://www.skepticalscience.com/print.php?n=670
As for Vostok, The limitations of trying to plot ~160 years of climate change on a graph where each pixel width represents ~580 years should be obvious, but in case it's not I'll spell it out you:
It's too fucking recent to show up.
Happy to put the accurate versions up, though, in case you need a reminder...
Nederland
(9,976 posts)The point of the second graph is to demonstrate that CO2 is not the only driver of climate change. You can see how the Minoan, Roman, and Medieval warm periods all occurred without a significant increase in CO2. Obviously CO2 has the ability to increase temperatures, but it is very difficult to determine what impact a given CO2 increase will have on climate. Accurate modeling is difficult because there are simply far too many other forcings at work that we do no fully understand.
Dead_Parrot
(14,478 posts)...that fudge their figures, and a bit more reading science journals, you may find "we" understand a bit more than you think.
Nederland
(9,976 posts)...that fudge their figures, and a bit more reading science journals, you may find "we" understand a bit more than you think.
Dead_Parrot
(14,478 posts)Can't say I spend a lot of time there, but I'll be sure to avoid them if you think it will help.

IbogaProject
(2,787 posts)This isn't going to be a minor shift in temperatures our whole civilization is going to collapse soon. This increase in CO2 is way faster then during any of the major climate extinction events.

bananas
(27,509 posts)These are charts I've posted in the past.
I've been having computer problems so it'll take some time for me to dig them up.
Dead_Parrot
(14,478 posts)This'll be a work in progress for some time.

OKIsItJustMe
(19,937 posts)Last edited Mon Jan 9, 2012, 11:22 AM - Edit history (2)
This first shows the linkage between temperatures and greenhouse gases (note that the X-axis measures time before the present, moving right takes you further into the past):
http://www.victoria.ac.nz/antarctic/research/research-prog/anzice/default.aspx
[font size=3 face=Times,Times New Roman,Serif]A record of greenhouse gases [carbon dioxide, methane] for the past 400,000 years as preserved in the Vostok Ice Core from Antarctica. The record shows ice ages when average temperatures were 6 - 8°C cooler than now. Such periods were punctuated by warm phases such as Stage 5e (red arrow) when temperatures were around 2°C warmer than today’s average. ANZICE will focus on those warm phases as case studies for what to expect in the future.[/font]
This next shows the linkage between glaciation and Milankovitch cycles (note that the X-axis measures time before the present, moving right takes you further into the past):
http://www.globalwarmingart.com/wiki/File:Milankovitch_Variations_png
The natural pattern appears to be relatively rapid warming (c. 10,000 years) initiated by Milankovitch cycles, and amplified by feedbacks (e.g. GHG’s, albedo) followed by much slower cooling (c. 100,000 years) note, moving right takes you forward in time:
http://www.globalwarmingart.com/wiki/File:deglaciation_png

Dead_Parrot
(14,478 posts)I've got the distinct feeling we may need to subdivide this. :s
OKIsItJustMe
(19,937 posts)The graph for “CO2 & Temp for 5 glaciations” reads the reverse of the other two. i.e. time moves forward from left to right.
(This is not what the OP indicates.)
Dead_Parrot
(14,478 posts)Sorry, I got carried away with the "before present"s.

OKIsItJustMe
(19,937 posts)Kudos on the formatting.
Dead_Parrot
(14,478 posts)...and we've got the sub and sup tags back, which helps.
OKIsItJustMe
(19,937 posts)I hadn’t noticed their return!

Systematic Chaos
(8,601 posts)And maybe with it show the one where they use a quadratic function to plot the arctic ice each month straight down to zero in another 5-30 years depending on the month.

XemaSab
(60,212 posts)Also,
 ?%3C?php%20echo%20time%28%29?
Kolesar
(31,182 posts)Guide to ... what?
XemaSab
(60,212 posts)Write one. 
Kolesar
(31,182 posts)"You have a better subject line?"
XemaSab
(60,212 posts)
Dead_Parrot
(14,478 posts)It's pretty much a placeholder.
OKIsItJustMe
(19,937 posts)(I assume that is the intent.)
Dead_Parrot
(14,478 posts)Bananas is digging some out: Finding ones that are recent, comprehensive and preferably updating is a bit of a mission, so it may be a while.
OKIsItJustMe
(19,937 posts)


OKIsItJustMe
(19,937 posts)


OKIsItJustMe
(19,937 posts)


FSSF
(17 posts)All here. The links are all .png images.
http://srren.ipcc-wg3.de/report/srren-figures-chapter-01/srren-figure-01.11
(Share of primary energy sources in world electricity generation in 2008.)
http://srren.ipcc-wg3.de/report/srren-figures-spm/srren-figure-spm.2
(Shares of energy sources in total global primary energy supply in 2008 (492 EJ). Modern biomass contributes 38% of the total biomass share.)
http://srren.ipcc-wg3.de/report/srren-figures-spm/srren-figure-spm.5
(Range in recent levelized cost of energy for selected commercially available RE technologies in comparison to recent non-renewable energy costs.)
http://srren.ipcc-wg3.de/report/srren-figures-spm/srren-figure-spm.08
(Estimates of lifecycle GHG emissions (g CO2eq/kWh) for broad categories of electricity generation technologies, plus some technologies integrated with CCS.)
http://srren.ipcc-wg3.de/report/srren-figures-chapter-09/srren-figure-09.15
(Comparison of fatality rates and maximum consequences of currently operating large centralized and decentralized energy technologies.)
http://srren.ipcc-wg3.de/report/srren-figures-chapter-10/srren-figure-10.19-2
(Overview of the relation between the primary energy contribution of RE (direct equivalent) and the corresponding technical potential for different technologies and regions for 2050 for the selected set of four scenarios.)
http://srren.ipcc-wg3.de/report/srren-figures-chapter-09/srren-figure-09.14
(Ranges of rates of operational water consumption by thermal and non-thermal electricity-generating technologies based on a review of available literature (m3/MWh).)

hatrack
(59,574 posts)YMMV

wtmusic
(39,166 posts)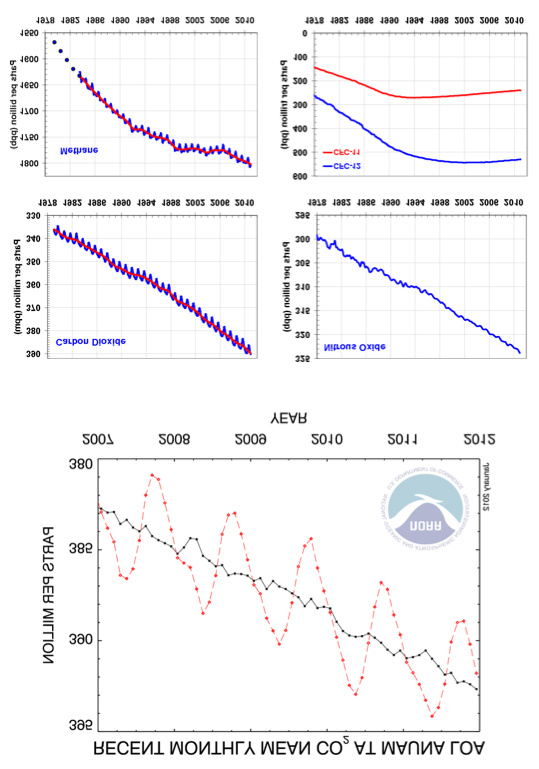


Response to XemaSab (Reply #18)
Name removed Message auto-removed


love it.

jpak
(41,756 posts)
OKIsItJustMe
(19,937 posts)In the US at least, by far the largest source of methane is… “Vented, fugitive and flared emissions from petroleum and natural gas systems.”
http://www.epa.gov/outreach/sources.html
http://www.epa.gov/outreach/downloads/TechNote_Natural%20gas_4-15-11.pdf
http://epa.gov/climatechange/emissions/usinventoryreport.html
Dead_Parrot
(14,478 posts)...at http://icp.giss.nasa.gov/education/methane/intro/cycle.html
Actually, I should re-word that bit: It makes it sound like bovine bottom burps are the only agricultural source, which ignores rice paddies.
OKIsItJustMe
(19,937 posts)Last edited Wed Jan 11, 2012, 12:48 PM - Edit history (1)
http://icp.giss.nasa.gov/education/methane/intro/cycle.htmlhttp://www.epa.gov/outreach/downloads/TechNote_Natural%20gas_4-15-11.pdf
- According to the latest inventory, CH[font size="1"]4[/font] emissions from natural gas systems are estimated to be 221.2 MMTCO[font size="1"]2[/font]e in 2009. Although the primary basis for CH[font size="1"]4[/font] emissions estimates in the Inventory remains a detailed 1996 study by the Gas Research Institute and EPA (1996 GRI/EPA), significant improvements were made to the emissions estimates in the current inventory, based in part on the large body of work carried out in developing subpart W (Petroleum and Natural Gas Systems) under the GHG Reporting Program. (Please see the Technical Support Document for subpart W at http://www.epa.gov/climatechange/emissions/downloads10/Subpart-W_TSD.pdf as well as additional support materials contained in Docket ID No. EPA-HQ-OAR-2009-0923 . )
- The net effect of these changes is a 120% increase from the 2008 emissions estimate. Vented, fugitive and flared emissions from petroleum and natural gas systems are now the largest source of CH[font size="1"]4[/font] emissions in the United States, replacing enteric fermentation.
- The large increase in emissions was primarily due to methodological improvements to three existing sources and the addition of two new sources.
- The three existing sources contributing to the large increase in emissions were gas well liquids unloading, condensate storage tanks and centrifugal compressors.
- The largest increase in emissions was due to the revised emission factor for gas well cleanups (also referred to as gas well liquids unloading). EPA used well production and well property sample data on well depth, shut-in pressure, and production rates in an engineering equation to re-estimate the average unloading emissions by region for this source (HPDI 2009). This improved data and methodological change increased emissions by more than 22 times while decreasing the substantial uncertainty associated with the previous emission factor that was derived from the EPA/GRI 1996 study. Emissions from liquids unloading in 2009 are estimated to be nearly 96 MMTCO[font size="1"]2[/font]e.
- For condensate storage tanks, EPA used the same E&P Tank simulation data for hydrocarbon liquids above 45 ̊API flashing emission in tanks as used in previous Inventories to estimate emissions. However, the analysis coupled these flashing emissions simulations with a large sample of condensate production gravities from the HPDI database to improve the factor to account for the average national distribution of condensate gravities. This is different from previous inventories in which a simple average of simulation results for each liquid gravity was used. Additionally, a sample of data from a 2009 Texas Environment Research Consortium (TERC) study was used to account for emissions from separator dump valve malfunctions in the regions represented by the study.
- For centrifugal compressor seals, EPA separated the centrifugal compressors emission source in the natural gas processing, transmission, and underground storage segments into two sources – centrifugal compressors equipped with wet seals and those with dry seals. EPA used data analysis on centrifugal compressor seal oil degassing vent rates (World Gas Conference 2009) to establish an emission factor for centrifugal compressor wet seal degassing and Natural Gas STAR’s Lessons Learned (EPA 2006) document to develop an emission factor for dry seal emissions. The seal oil degassing vent (found with compressors using wet seals) was previously unaccounted for in the Inventory.
XemaSab
(60,212 posts)and
Dead_Parrot
(14,478 posts)Without context, it's kind of just a map of places to snowboard. 
XemaSab
(60,212 posts)
No, but seriously, here's the context for California, at least:
OKIsItJustMe
(19,937 posts)This year (apparently) is starting out dryer than average, but wetter than 76-77. Whereas last year was generally wetter than average, but not as wet as 82-83.
This doesn’t seem to say much about long term trends.
Maybe I’m missing something.
XemaSab
(60,212 posts)It's about whether or not California will have enough water for fish and farmers next year.
OKIsItJustMe
(19,937 posts)(Thanks.)

joshcryer
(62,265 posts)truebrit71
(20,805 posts)...So much for 330 ppm being the magical maximum safe number...
Dead_Parrot
(14,478 posts)At least, the trend is at 393: The actual reading is 392, but give it a month or two - there's an annual cycle.
Deep joy.
OKIsItJustMe
(19,937 posts)…
[font size=2]Abstract: Paleoclimate data show that climate sensitivity is ~3°C for doubled CO[font size="1"]2[/font], including only fast feedback processes. Equilibrium sensitivity, including slower surface albedo feedbacks, is ~6°C for doubled CO[font size="1"]2[/font] for the range of climate states between glacial conditions and ice-free Antarctica. Decreasing CO[font size="1"]2[/font] was the main cause of a cooling trend that began 50 million years ago, the planet being nearly ice-free until CO[font size="1"]2[/font] fell to 450 ± 100 ppm; barring prompt policy changes, that critical level will be passed, in the opposite direction, within decades. If humanity wishes to preserve a planet similar to that on which civilization developed and to which life on Earth is adapted, paleoclimate evidence and ongoing climate change suggest that CO[font size="1"]2[/font] will need to be reduced from its current 385 ppm to at most 350 ppm, but likely less than that. The largest uncertainty in the target arises from possible changes of non-CO[font size="1"]2[/font] forcings. An initial 350 ppm CO[font size="1"]2[/font] target may be achievable by phasing out coal use except where CO[font size="1"]2[/font] is captured and adopting agricultural and forestry practices that sequester carbon. If the present overshoot of this target CO[font size="1"]2[/font] is not brief, there is a possibility of seeding irreversible catastrophic effects.[/font]…
[font size=4]5. SUMMARY[/font]
…
Humanity’s task of moderating human-caused global climate change is urgent. Ocean and ice sheet inertias provide a buffer delaying full response by centuries, but there is a danger that human-made forcings could drive the climate system beyond tipping points such that change proceeds out of our control. The time available to reduce the human-made forcing is uncertain, because models of the global system and critical components such as ice sheets are inadequate. However, climate response time is surely less than the atmospheric lifetime of the human-caused perturbation of CO[font size="1"]2[/font]. Thus remaining fossil fuel reserves should not be exploited without a plan for retrieval and disposal of resulting atmospheric CO[font size="1"]2[/font].
Paleoclimate evidence and ongoing global changes imply that today’s CO[font size="1"]2[/font], about 385 ppm, is already too high to maintain the climate to which humanity, wildlife, and the rest of the biosphere are adapted. Realization that we must reduce the current CO[font size="1"]2[/font] amount has a bright side: effects that had begun to seem inevitable, including impacts of ocean acidification, loss of fresh water supplies, and shifting of climatic zones, may be averted by the necessity of finding an energy course beyond fossil fuels sooner than would otherwise have occurred.
We suggest an initial objective of reducing atmospheric CO[font size="1"]2[/font] to 350 ppm, with the target to be adjusted as scientific understanding and empirical evidence of climate effects accumulate. Although a case already could be made that the eventual target probably needs to be lower, the 350 ppm target is sufficient to qualitatively change the discussion and drive fundamental changes in energy policy. Limited opportunities for reduction of non-CO[font size="1"]2[/font] human-caused forcings are important to pursue but do not alter the initial 350 ppm CO[font size="1"]2[/font] target. This target must be pursued on a timescale of decades, as paleoclimate and ongoing changes, and the ocean response time, suggest that it would be foolhardy to allow CO[font size="1"]2[/font] to stay in the dangerous zone for centuries.
…[/font]
http://arxiv.org/abs/0804.1126
http://www.350.org
Dead_Parrot
(14,478 posts)...aiming for 400 is unrealistic, and 450 seems optimistic.
I wonder if we can keep it under 500?
OKIsItJustMe
(19,937 posts)Hansen et al. aren’t talking about stopping the increase at 350 ppm (or even 400 ppm.)
What they’re talking about is minimizing the “overshoot,” stopping it as little above 400 ppm as possible so that we can bring it back down to 350 ppm ASAP.
To do that (IMHO) will require some sort of active removal of CO[font size="1"]2[/font] from the atmosphere. Hanson et al. suggest, “A reward system for improved agricultural and forestry practices that sequester carbon…” but I don’t think that will be sufficient.
Can we stop the increase before 450? Maybe. But only if we actually make a concerted effort (which, so far, we don’t seem to be doing.)
Dead_Parrot
(14,478 posts)There's a paper at http://pubs.acs.org/doi/abs/10.1021/ja202642y which toys with doing this mainly for a fuel source (It has that advantage that we don't need to replace our entire transport infrastructure) but we could over-produce: sucking atmospheric CO2 up, reforming it into CH3OH or CH3OCH3 and pumping it into Ghawar would be a straightforward operation, albeit a money hole. and yes, we can re-grow a lot of forest and get carbon back into the soil.
What we can't do is re-freeze the permafrost or re-create hydrates when the surrounding temperatures are too high, so any carbon from these sources is probably going to be kicking around until the Milankovitch cycles swing back in our favour. And since we seem to dragging our heels just a little, this is going to be most of it.
OKIsItJustMe
(19,937 posts)Some people shy away from these, since they are “geoengineering” (and therefore bad.)
To my way of thinking, any actions we take, in a conscious effort to effect the climate (say… planting lots and lots of trees) are geoengineering, and if Hansen et al. are correct, we need to start geoengineering soon.
truebrit71
(20,805 posts)D'oh!! As a subscriber to 350.org you would have thought I could've remembered that!!

Kablooie
(18,608 posts)Anyone can draw a chart.
You just scribble your hand around and make any kind of chart you want.
If Rush Limbaugh and Fox News BOTH say global warming is fake, that's good enough for me!


Odin2005
(53,521 posts)wtmusic
(39,166 posts)Kicking for the joy of kicking.
XemaSab
(60,212 posts)XemaSab
(60,212 posts)
pumaman
(5 posts)Interesting and detailed data. But I am very surprised that critical data is missing on the amount of radiation that reaches earth. The earths temperature is mostly dependent on the percentage of the suns radiation that is absorbed by the earth. In this simple energy balance equation, what is most important is the amount of solar radiation emitted by the sun (dependent on sunspot activity), the earth-sun distance (radiational energy goes as the 4th power of solar-earth distance). Also, the radiation passed through the Van Allen Belts, radiation passed through the stratosphere, and reflected off the clouds and surface (albedo). The greenhouse effect, vulcanism and other phenomena act as to modify the net radiation that reaches earth.
All of these data has changed rapidly both in short term and long term earth history. In particular, radiational energy and orbital variation is crucial to understand earth climate physics. The data is available on wikipedia.
edit: i underestimated the effect of vulcanism by calling it a modifier. while recent volcanic activity has had an (arguable) minor to moderate impact on global climate change, historically there have been severe volcanic activity that has grossly altered both geologic makeup and even total life on the planet. A perfect example of course would be the Deccan Flats in India.
edit2: Correction. its been brought to my attention that external phenomena -- specifically asteroid collisions -- have also had a severe effect upon both atmospheric conditions and life on the planet. In particular, the asteroid collision creating the Cretacious-Tertiary layer, *may* have increased Co2 by 10 fold, tripled planetary albedo, and thus reduced the surface temperature by over 10 deg C on average, leading to mass animal and plant specie extinction.
pumaman
(5 posts)Flat earthers claimed the earth was, well, flat. That it had two dimensions. This theory started thousands of years ago, and lasted for thousands of years aftwerward. Egyptians invented the most sophisticated instruments, greeks the most elegant mathematics. After years of testing and argument, there was hardly any disputing. Except... certain egyptians who invented the transit noted that their flad earth formulae did not work. They were called crazy, hegemonists, reactionaries. They were told that 90 percent of scientists believed the earth was flat. So round earthers were silenced.
Finally, in the 1400's, legions of data poured in to verify the round earthers. Sir Isaac Newton composed the Theory of Mechanics, based on the fact that the world, our universe, is 3 dimensional. Philosophers could not argue with his logic or data. But For 400 years, they tested it over and over again. Each time, the theory was proven 100%, and I mean physically and mathematically. until finally, about the turn of 1900, virtually everyone accepted Newtonian Dynamics as the one true underlying, God spoken, unquestionable theory of how the universe operated.
And yet their were hints of problems and flaws in Newtons theory. They could not explain the absorption bands of helium, or diffraction. Those folks were hurried off as crackpots and incompetents.
Then, around 1910, some guy named Einstein came around. He said the world was NOT 3 dimensional. That it was four dimensional. He postulated, The earths diameter was not the distance between both sides; it was the distance required for light to travel between both sides.
They called Einstein crazy. But, Physicists begrudgingly could not argue with his logic or data. But for the next 90 years, they relentlessly tested every and all aspects of the theory, in the most incredible and difficult tests imaginable. Every time, each test was 100% conclusive: Newton was wrong. Einstein was right. So after 90 years of testing, with 100 pct undeniable conclusivity, they finally accept Einstein's theory of relativity. For now...
Now we come to climate change. The data for this theory is mostly correlational. There are plenty of holes, and it is far from 100% proven. Advocates consistently make crucial errors of omission, such as radiational variation, as I politiely made in my previous post. Logically then, shall I conclude that man made global warming advocates are thus "round earthers"? ironically both camps are wrong. The earth is not flat. It is not round either. it is 4 dimensional. You are both technically speaking, ignorant of hundreds of years of laborious painstaking testing of scientific facts.
If ever a scientist should dispute a theory, not politically or emotionally, but scientifically, this is the time. And yet when scientists do try to question the theory, they are met with obtuse graphs, followed by political accusations, and as I have seen in the history of this thread, followed by ad hominem attacks and labels, such as "deniers" and "flat earthers", followed by threats of total censorship, then heartbreakingly, by permanent ban for failure of obeyance and toeing the party line.
Now the scientific question then becomes for me is, not whether man made global warming exists, it becomes instead, will I be banned from this site for Questioning Authority. Kinda funny when you think about it, eh? But, Truth is truth, and bending it to fit some pseudo intellectual point du jour is hopeless wishful thinking and bound for failure anyways, so my choice is not really a question at all. I have to try to enlighten, now matter what the consequence. Life and truth is too short and too valuable to risk just for the sake of a membership on some bulletin board.
Man Made global climate change is unproven. Far from it. Mark my words, this could be a fatal political error for Democrats to pile all their eggs into. As fatal for republicans to pour all their eggs into fossil fuel energy.
XemaSab
(60,212 posts)Last edited Tue Sep 4, 2012, 07:09 PM - Edit history (3)
Humans will protect the environment, unless it costs money, or causes any inconvenience whatsoever.
And
It's always faster than expected. Even if you take XemaSab's law into account.
And courtesy of Speck Tater:
The pace of climate change is beginning to be faster than the pace of research and publication about climate change.

phantom power
(25,966 posts)XemaSab
(60,212 posts) AldoLeopold
(617 posts)dunno if that's allowed - I'm trying to figure out how you posted these charts - cited them, etc. How does one do that?
I have a ton of great slides from an air pollution lecture last semester - juicy stuff.
Bill USA
(6,436 posts)the last 60 to 100 yrs?

Blue_Tires
(55,445 posts)Many thanks indeed..
EnvironmentalVK
(6 posts)Thank you.
I frequently refer to this website:
http://co2now.org/
Here is the IPPC Report
http://www.ipcc.ch/publications_and_data/ar4/wg1/en/ch9s9-7.html
7 Combining Evidence of Anthropogenic Climate Change
<
>
The widespread change detected in temperature observations of the surface (Sections 9.4.1, 9.4.2, 9.4.3), free atmosphere (Section 9.4.4) and ocean (Section 9.5.1), together with consistent evidence of change in other parts of the climate system (Section 9.5), strengthens the conclusion that greenhouse gas forcing is the dominant cause of warming during the past several decades. This combined evidence, which is summarized in Table 9.4, is substantially stronger than the evidence that is available from observed changes in global surface temperature alone (Figure 3.6).
The evidence from surface temperature observations is strong: The observed warming is highly significant relative to estimates of internal climate variability which, while obtained from models, are consistent with estimates obtained from both instrumental data and palaeoclimate reconstructions. It is extremely unlikely (<5%) that recent global warming is due to internal variability alone such as might arise from El Niño (Section 9.4.1). The widespread nature of the warming (Figures 3.9 and 9.6) reduces the possibility that the warming could have resulted from internal variability. No known mode of internal variability leads to such widespread, near universal warming as has been observed in the past few decades. Although modes of internal variability such as El Niño can lead to global average warming for limited periods of time, such warming is regionally variable, with some areas of cooling (Figures 3.27 and 3.28). In addition, palaeoclimatic evidence indicates that El Niño variability during the 20th century is not unusual relative to earlier periods (Section 9.3.3.2; Chapter 6). Palaeoclimatic evidence suggests that such a widespread warming has not been observed in the NH in at least the past 1.3 kyr (Osborn and Briffa, 2006), further strengthening the evidence that the recent warming is not due to natural internal variability. Moreover, the response to anthropogenic forcing is detectable on all continents individually except Antarctica, and in some sub-continental regions. Climate models only reproduce the observed 20th-century global mean surface warming when both anthropogenic and natural forcings are included (Figure 9.5). No model that has used natural forcing only has reproduced the observed global mean warming trend or the continental mean warming trends in all individual continents (except Antarctica) over the second half of the 20th century. Detection and attribution of external influences on 20th-century and palaeoclimatic reconstructions, from both natural and anthropogenic sources (Figure 9.4 and Table 9.4), further strengthens the conclusion that the observed changes are very unusual relative to internal climate variability.
The energy content change associated with the observed widespread warming of the atmosphere is small relative to the energy content change of the ocean, and also smaller than that associated with other components such as the cryosphere. In addition, the solid Earth also shows evidence for warming in boreholes (Huang et al., 2000; Beltrami et al., 2002; Pollack and Smerdon, 2004). It is theoretically feasible that the warming of the near surface could have occurred due to a reduction in the heat content of another component of the system. However, all parts of the cryosphere (glaciers, small ice caps, ice sheets and sea ice) have decreased in extent over the past half century, consistent with anthropogenic forcing (Section 9.5.5, Table 9.4), implying that the cryosphere consumed heat and thus indicating that it could not have provided heat for atmospheric warming. More importantly, the heat content of the ocean (the largest reservoir of heat in the climate system) also increased, much more substantially than that of the other components of the climate system (Figure 5.4; Hansen et al., 2005; Levitus et al., 2005). The warming of the upper ocean during the latter half of the 20th century was likely due to anthropogenic forcing (Barnett et al., 2005; Section 9.5.1.1; Table 9.4). While the statistical evidence in this research is very strong that the warming cannot be explained by ocean internal variability as estimated by two different climate models, uncertainty arises since there are discrepancies between estimates of ocean heat content variability from models and observations, although poor sampling of parts of the World Ocean may explain this discrepancy. However, the spatial pattern of ocean warming with depth is very consistent with heating of the ocean resulting from net positive radiative forcing, since the warming proceeds downwards from the upper layers of the ocean and there is deeper penetration of heat at middle to high latitudes and shallower penetration at low latitudes (Barnett et al., 2005; Hansen et al., 2005). This observed ocean warming pattern is inconsistent with a redistribution of heat between the surface and the deep ocean.
Thus, the evidence appears to be inconsistent with the ocean or land being the source of the warming at the surface. In addition, simulations forced with observed SST changes cannot fully explain the warming in the troposphere without increases in greenhouse gases (e.g., Sexton et al., 2001), further strengthening the evidence that the warming does not originate from the ocean. Further evidence for forced changes arises from widespread melting of the cryosphere (Section 9.5.5), increases in water vapour in the atmosphere (Section 9.5.4.1) and changes in top-of-the atmosphere radiation that are consistent with changes in forcing.
The simultaneous increase in energy content of all the major components of the climate system and the pattern and amplitude of warming in the different components, together with evidence that the second half of the 20th century was likely the warmest in 1.3 kyr (Chapter 6) indicate that the cause of the warming is extremely unlikely to be the result of internal processes alone. The consistency across different lines of evidence makes a strong case for a significant human influence on observed warming at the surface. The observed rates of surface temperature and ocean heat content change are consistent with the understanding of the likely range of climate sensitivity and net climate forcings. Only with a net positive forcing, consistent with observational and model estimates of the likely net forcing of the climate system (as used in Figure 9.5), is it possible to explain the large increase in heat content of the climate system that has been observed (Figure 5.4).
Table 9.4. A synthesis of climate change detection results: (a) surface and atmospheric temperature evidence and (b) evidence from other variables. Note that our likelihood assessments are reduced compared to individual detection studies in order to take into account remaining uncertainties (see Section 9.1.2), such as forcing and model uncertainty not directly accounted for in the studies. The likelihood assessment is indicated in percentage terms, in parentheses where the term is not from the standard IPCC likelihood levels.
a)
Result
Region
Likelihood
Factors contributing to likelihood assessment
Surface temperature
Warming during the past half century cannot be explained without external radiative forcing Global Extremely likely (>95%) Anthropogenic change has been detected in surface temperature with very high significance levels (less than 1% error probability). This conclusion is strengthened by detection of anthropogenic change in the upper ocean with high significance level. Upper ocean warming argues against the surface warming being due to natural internal processes. Observed change is very large relative to climate-model simulated internal variability. Surface temperature variability simulated by models is consistent with variability estimated from instrumental and palaeorecords. Main uncertainty from forcing and internal variability estimates (Sections 9.4.1.2, 9.4.1.4, 9.5.1.1, 9.3.3.2, 9.7).
Warming during the past half century is not solely due to known natural causes Global Very Likely This warming took place at a time when non-anthropogenic external factors would likely have produced cooling. The combined effect of known sources of forcing would have been extremely likely to produce a warming. No climate model that has used natural forcing only has reproduced the observed global warming trend over the 2nd half of the 20th century. Main uncertainties arise from forcing, including solar, model-simulated responses and internal variability estimates (Sections 2.9.2, 9.2.1, 9.4.1.2, 9.4.1.4; Figures 9.5, 9.6, 9.9).
Greenhouse gas forcing has been the dominant cause of the observed global warming over the last 50 years. Global Very likely All multi-signal detection and attribution studies attribute more warming to greenhouse gas forcing than to a combination of all other sources considered, including internal variability, with a very high significance. This conclusion accounts for observational, model and forcing uncertainty, and the possibility that the response to solar forcing could be underestimated by models. Main uncertainty from forcing and internal variability estimates (Section 9.4.1.4; Figure 9.9).
Increases in greenhouse gas concentrations alone would have caused more warming than observed over the last 50 years because volcanic and anthropogenic aerosols have offset some warming that would otherwise have taken place. Global Likely Estimates from different analyses using different models show consistently more warming than observed over the last 50 years at the 5% significance level. However, separation of the response to non-greenhouse gas (particularly aerosol) forcing from greenhouse gas forcing varies between models (Section 9.4.1.4; Figure 9.9).
There has been a substantial anthropogenic contribution to surface temperature increases in every continent except Antarctica since the middle of the 20th century Africa, Asia, Australia, Europe, North America and South America Likely Anthropogenic change has been estimated using detection and attribution methods on every individual continent (except Antarctica). Greater variability compared to other continental regions makes detection more marginal in Europe. No climate model that used natural forcing only reproduced the observed continental mean warming trend over the second half of the 20th century. Uncertainties arise because sampling effects result in lower signal-to-noise ratio at continental than at global scales. Separation of the response to different forcings is more difficult at these spatial scales (Section 9.4.2; FAQ 9.2, Figure 1).
Early 20th-century warming is due in part to external forcing. Global Very Likely A number of studies detect the influence of external forcings on early 20th-century warming, including a warming from anthropogenic forcing. Both natural forcing and response are uncertain, and different studies find different forcings dominant. Some studies indicate that internal variability could have made a large contribution to early 20th-century warming. Some observational uncertainty in early 20th-century trend (Sections 9.3.3.2, 9.4.1.4; Figures 9.4, 9.5).
Result
Region
Likelihood
Factors contributing to likelihood assessment
Surface temperature
Pre-industrial temperatures were influenced by natural external forcing (period studied is past 7 centuries) NH (mostly extratropics) Very Likely Detection studies indicate that external forcing explains a substantial fraction of inter-decadal variability in NH temperature reconstructions. Simulations in response to estimates of pre-industrial forcing reproduce broad features of reconstructions. Substantial uncertainties in reconstructions and past forcings are unlikely to lead to a spurious agreement between temperature reconstructions and forcing reconstructions as they are derived from independent proxies (Section 9.3.3; Figures 9.4, 6.13).
Temperature extremes have changed due to anthropogenic forcing NH land areas and Australia combined. Likely A range of observational evidence indicates that temperature extremes are changing. An anthropogenic influence on the temperatures of the 1, 5, 10 and 30 warmest nights, coldest days and coldest nights annually has been formally detected and attributed in one study, but observed change in the temperature of the warmest day annually is inconsistent with simulated change. The detection of changes in temperature extremes is supported by other comparisons between models and observations. Model uncertainties in changes in temperature extremes are greater than for mean temperatures and there is limited observational coverage and substantial observational uncertainty (Section 9.4.3).
Free atmosphere changes
Tropopause height increases are detectable and attributable to anthropogenic forcing (latter half of the 20th century) Global Likely There has been robust detection of anthropogenic influence on increasing tropopause height. Simulated tropopause height increases result mainly from greenhouse gas increases and stratospheric ozone decreases. Detection and attribution studies rely on reanalysis data, which are subject to inhomogeneities related to differing availability and quality of input data, although tropopause height increases have also been identified in radiosonde observations. Overall tropopause height increases in recent model and one reanalysis (ERA-40) appear to be driven by similar large-scale changes in atmospheric temperature, although errors in tropospheric warming and stratospheric cooling could lead to partly spurious agreement in other data sets (Section 9.4.4.2; Figure 9.14).
Tropospheric warming is detectable and attributable to anthropogenic forcing (latter half of the 20th century) Global Likely There has been robust detection and attribution of anthropogenic influence on tropospheric warming, which does not depend on including stratospheric cooling in the fingerprint pattern of response. There are observational uncertainties in radiosonde and satellite records. Models generally predict a relative warming of the free troposphere compared to the surface in the tropics since 1979, which is not seen in the radiosonde record (possibly due to uncertainties in the radiosonde record) but is seen in one version of the satellite record, although not others (Section 9.4.4).
Simultaneous tropospheric warming and stratospheric cooling due to the influence of anthropogenic forcing has been observed (latter half of the 20th century) Global Very Likely Simultaneous warming of the troposphere and cooling of the stratosphere due to natural factors is less likely than warming of the troposphere or cooling of the stratosphere alone. Cooling of the stratosphere is in part related to decreases in stratospheric ozone. Modelled and observational uncertainties as discussed under entries for tropospheric warming with additional uncertainties due to stratospheric observing systems and the relatively poor representations of stratospheric processes and variability in climate models (Section 9.4.4).
b)
Result
Region
Likelihood
Factors contributing to likelihood assessment
Ocean changes
Anthropogenic forcing has warmed the upper several hundred metres of the ocean during the latter half of the 20th century Global (but with limited sampling in some regions) Likely Robust detection and attribution of anthropogenic fingerprint from three different models in ocean temperature changes, and in ocean heat content data, suggests high likelihood, but observational and modelling uncertainty remains. 20th-century simulations with MMD models simulate comparable ocean warming to observations only if anthropogenic forcing is included. Simulated and observed variability appear inconsistent, either due to sampling errors in the observations or under-simulated internal variability in the models. Limited geographical coverage in some ocean basins (Section 9.5.1.1; Figure 9.15).
Anthropogenic forcing contributed to sea level rise during the latter half 20th century Global Very likely Natural factors alone do not satisfactorily explain either the observed thermal expansion of the ocean or the observed sea level rise. Models including anthropogenic and natural forcing simulate the observed thermal expansion since 1961 reasonably well. Anthropogenic forcing dominates the surface temperature change simulated by models, and has likely contributed to the observed warming of the upper ocean and widespread glacier retreat. It is very unlikely that the warming during the past half century is due only to known natural causes. It is therefore very likely that anthropogenic forcing contributed to sea level rise associated with ocean thermal expansion and glacier retreat. However, it remains difficult to estimate the anthropogenic contribution to sea level rise because suitable studies quantifying the anthropogenic contribution to sea level rise and glacier retreat are not available, and because the observed sea level rise budget is not closed (Table 9.2; Section 9.5.2).
Circulation
Sea level pressure shows a detectable anthropogenic signature during the latter half of the 20th century Global Likely Changes of similar nature are observed in both hemispheres and are qualitatively, but not quantitatively consistent with model simulations. Uncertainty in models and observations. Models underestimate the observed NH changes for reasons that are not understood, based on a small number of studies. Simulated response to 20th century forcings is consistent with observations in SH if effect of stratospheric ozone depletion is included (Section 9.5.3.4; Figure 9.16).
Anthropogenic forcing contributed to the increase in frequency of the most intense tropical cyclones since the 1970s Tropical regions More likely than not (>50%) Recent observational evidence suggests an increase in frequency of intense storms. Increase in intensity is consistent with theoretical expectations. Large uncertainties due to models and observations. Modelling studies generally indicate a reduced frequency of tropical cyclones in response to enhanced greenhouse gas forcing, but an increase in the intensity of the most intense cyclones. Observational evidence, which is affected by substantial inhomogeneities in tropical cyclone data sets for which corrections have been attempted, suggests that increases in cyclone intensity since the 1970s are associated with SST and atmospheric water vapour increases (Section 3.8.3, Box 3.5 and Section 9.5.2.6).
Precipitation, Drought, Runoff
Volcanic forcing influences total rainfall Global land areas More likely than not (>50%) Model response detectable in observations for some models and result supported by theoretical understanding. However, uncertainties in models, forcings and observations. Limited observational sampling, particularly in the SH (Section 9.5.4.2; Figure 9.18).
Increases in heavy rainfall are consistent with anthropogenic forcing during latter half 20th century Global land areas (limited sampling) More likely than not (>50%) Observed increases in heavy precipitation appear to be consistent with expectations of response to anthropogenic forcing. Models may not represent heavy rainfall well; observations suffer from sampling inadequacies (Section 9.5.4.2).
Result
Region
Likelihood
Factors contributing to likelihood assessment
Precipitation, Drought, Runoff
Increased risk of drought due to anthropogenic forcing during latter half 20th century Global land areas More likely than not (>50%) One detection study has identified an anthropogenic fingerprint in a global Palmer Drought Severity Index data set with high significance, but the simulated response to anthropogenic and natural forcing combined is weaker than observed, and the model appears to have less inter-decadal variability than observed. Studies of some regions indicate that droughts in those regions are linked either to SST changes that, in some instances, may be linked to anthropogenic aerosol forcing (e.g., Sahel) or to a circulation response to anthropogenic forcing (e.g., southwest Australia). Models, observations and forcing all contribute uncertainty (Section 9.5.3.2).
Cryosphere
Anthropogenic forcing has contributed to reductions in NH sea ice extent during the latter half of the 20th century Arctic Likely The observed change is qualitatively consistent with model-simulated changes for most models and expectation of sea ice melting under arctic warming. Sea ice extent change detected in one study. The model used has some deficiencies in arctic sea ice annual cycle and extent. The conclusion is supported by physical expectations and simulations with another climate model. Change in SH sea ice probably within range explained by internal variability (Section 9.5.5.1).
Anthropogenic forcing has contributed to widespread glacier retreat during the 20th century Global Likely Observed changes are qualitatively consistent with theoretical expectations and temperature detection. Anthropogenic contribution to volume change difficult to estimate. Few detection and attribution studies, but retreat in vast majority of glaciers consistent with expected reaction to widespread warming (Section 9.5.5.3).
PoutrageFatigue
(416 posts)...Many thanks!
jpak
(41,756 posts)
Novara
(5,821 posts)....especially the last one!
OKIsItJustMe
(19,937 posts)[font size=5]Annual Mean Growth Rate for Mauna Loa, Hawaii[/font]
[font size=3]

The table and the graph show annual mean carbon dioxide growth rates for Mauna Loa. In the graph, also decadal averages of the growth rate are plotted, as horizontal lines for 1960 through 1969, 1970 through 1979, and so on.
…[/font][/font]
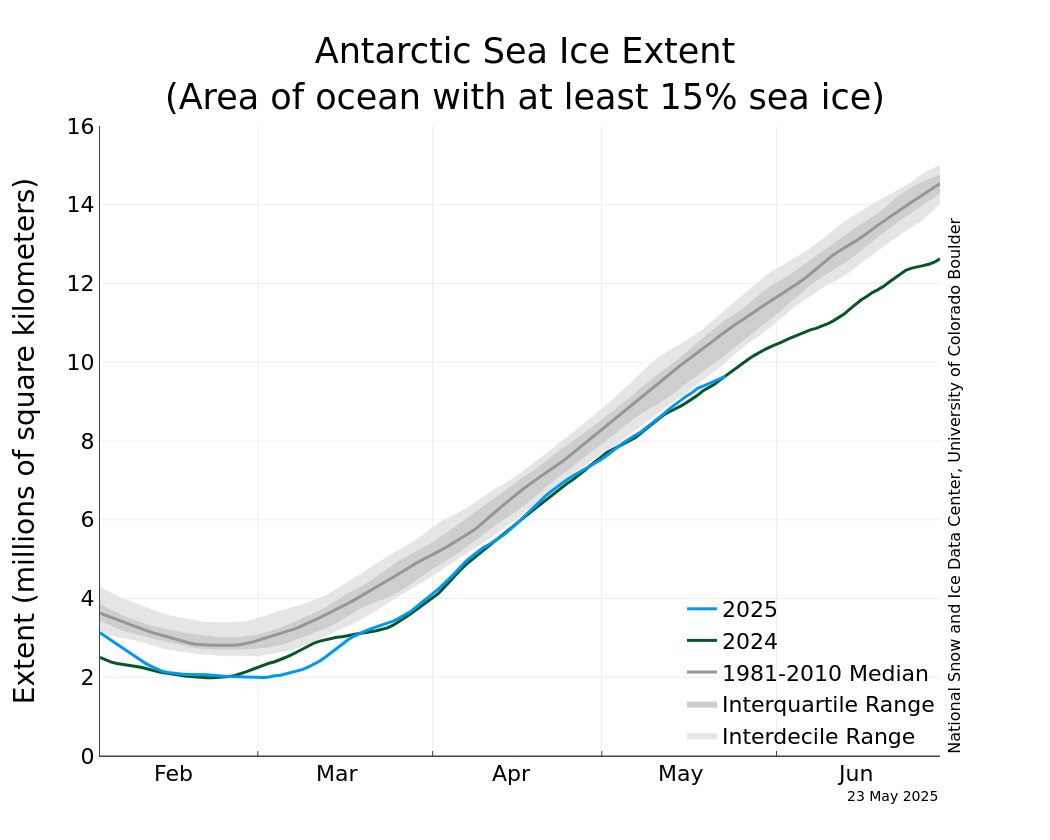
muriel_volestrangler
(101,265 posts)The ice area and ice extent figures that are often quoted (the area figures are linked in the OP) have come from the DMSP F-17 satellite, which has been unable to give reliable data since the beginning of April.
So here's the data from the Japanese AMSR-2 satellite:
https://ads.nipr.ac.jp/vishop/vishop-extent.html
Like the NSIDC ice extent data, 2016 had the lowest maximum in recent years, and it's still the lowest for this date.
BarbaraChipps
(10 posts)If you've got questions about climate change feel free to ask, but if you repeatedly post denialist rubbish you are liable to be shown the door...
progree
(10,890 posts)
Let the, err, Chipps fall where they may.
False Progress
(2 posts)Before joining this forum, I was warned that any critique of technologies that require vast amounts of land (and ocean) space to produce intermittent power, are not allowed and may result in immediate banning. This strikes me as un-democratic at the very least.
The apparent assumption is that anyone who upholds the original tenets of environmentalism (e.g. tread lightly and do no harm) must have hidden motives if they criticize a particular form of energy sprawl, which happens to be its most highly visible form. See The Nature Conservancy's articles on "energy sprawl" as a primer. I assume that organization is respected here?
Reading this site's terms of service, I see no mention of such limits to discussion, unless one is assumed to be "right-wing" for wanting to protect open space and wildlife from all forms of man-made development, and not just seeking to coddle the endless growth of civilization with new energy sources.
I'm asking the moderators to clarify whether one can argue for saving landscapes, seascapes and wildlife from industrial wind turbines in this forum without being banned. I think it's a critically important topic from a pro-environment point of view.
Look up the word "windschmerz" for my general positions. My opinions of actual right-wingers can be found on that same blog under "anti-nature."
I think the Democratic Party has forsaken old environmental protections due to an extreme focus on AGW, and needs to re-balance itself.

BumRushDaShow
(128,439 posts)
marble falls
(56,997 posts)OKIsItJustMe
(19,937 posts)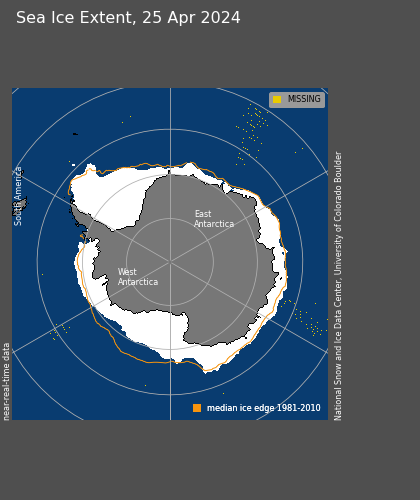
University of Bremen: Antarctic Sea Ice Concentration:
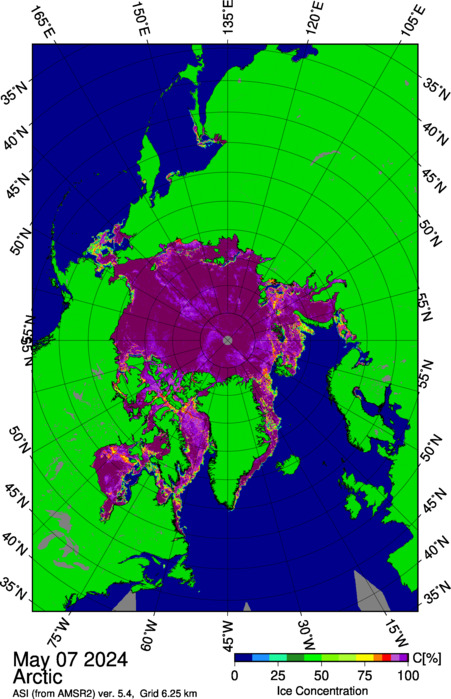
OKIsItJustMe
(19,937 posts)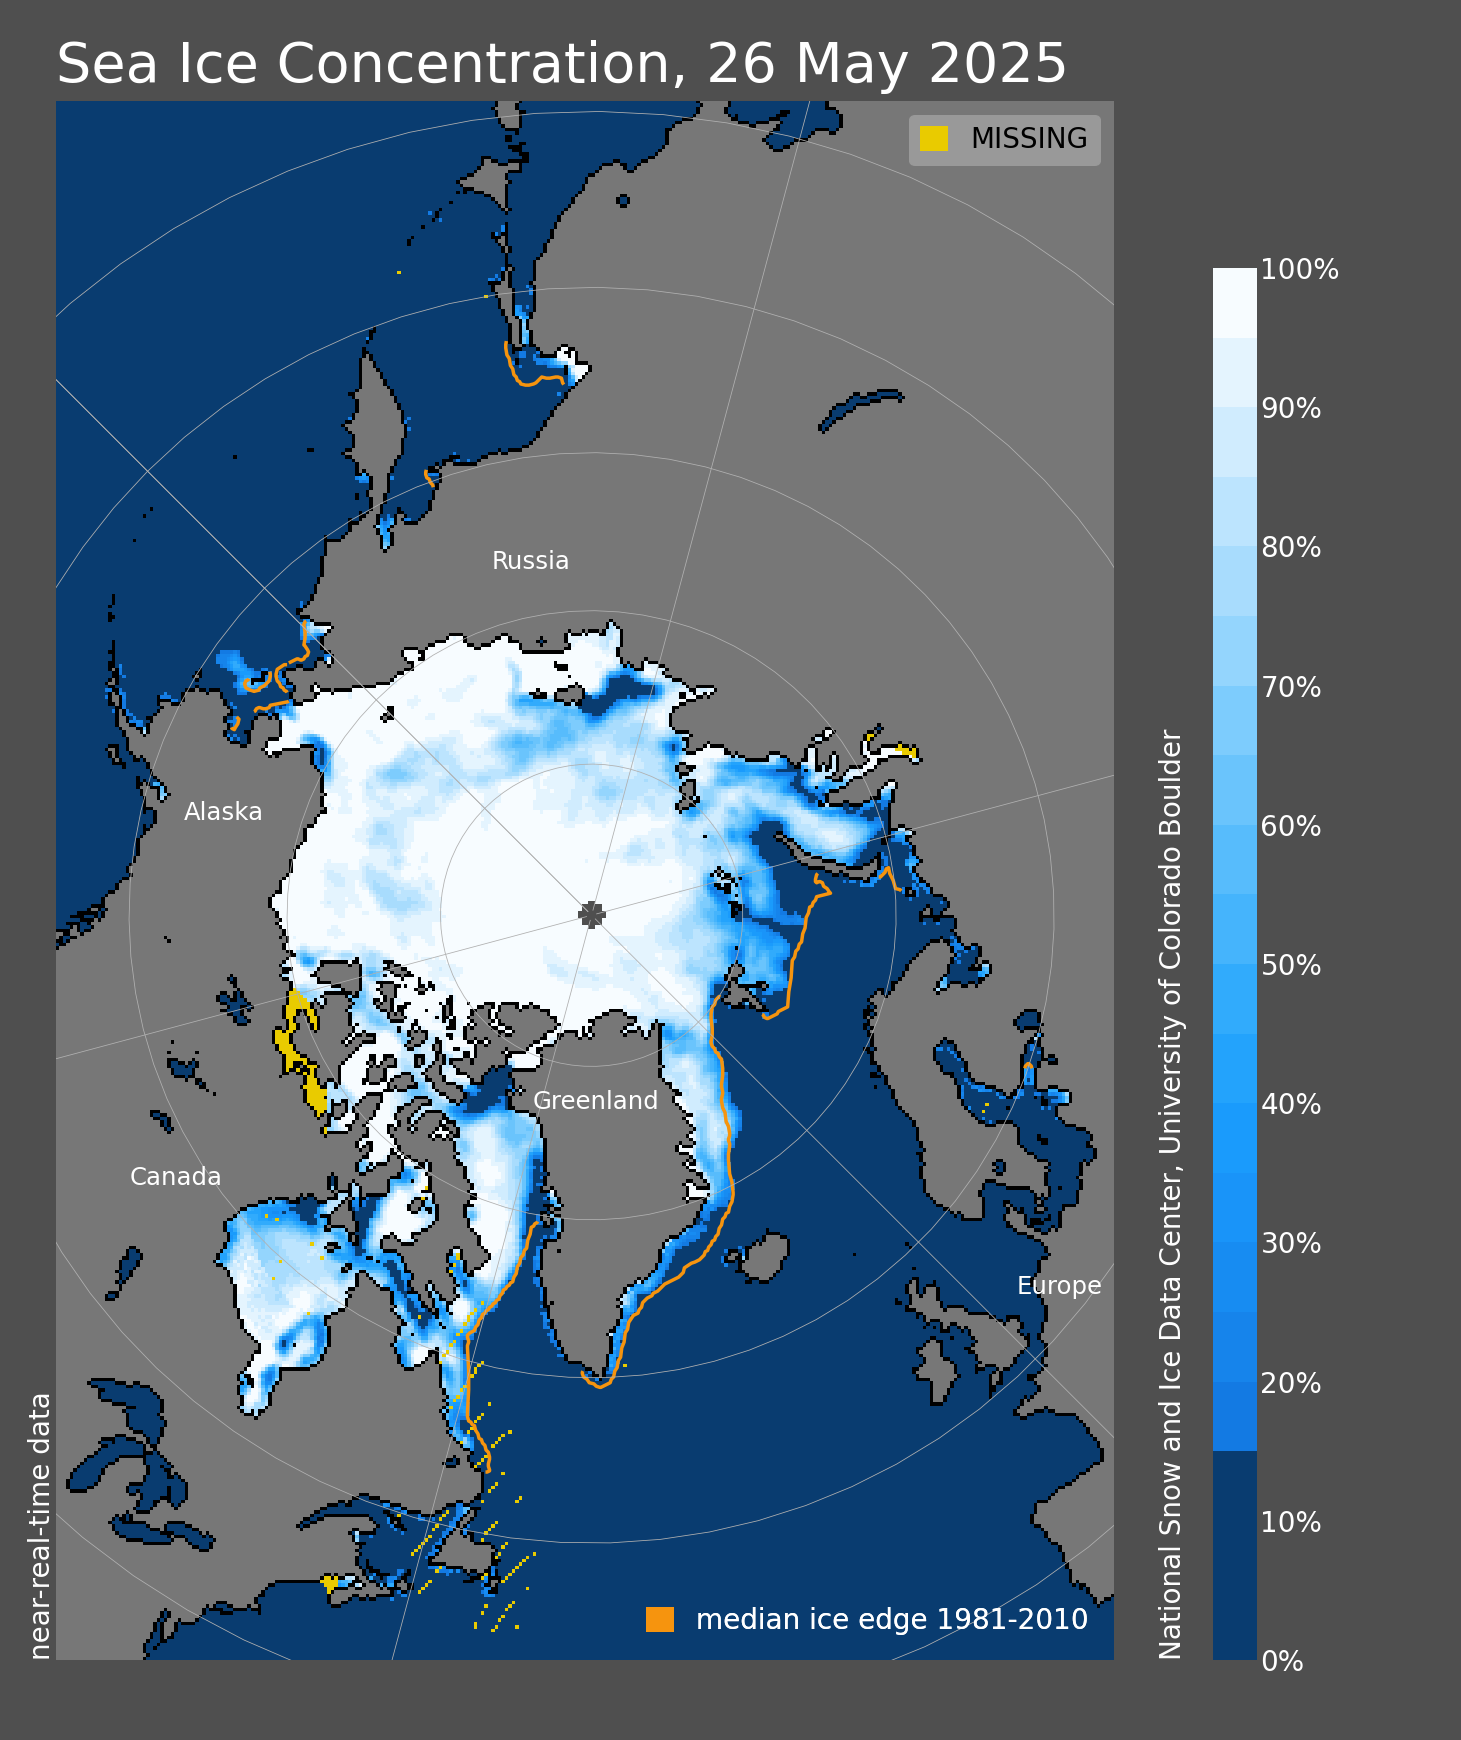


University of Bremen: Arctic Sea Ice Concentration:
Polar Science Center: PIOMAS Arctic Sea Ice Volume Reanalysis: