Environment & Energy
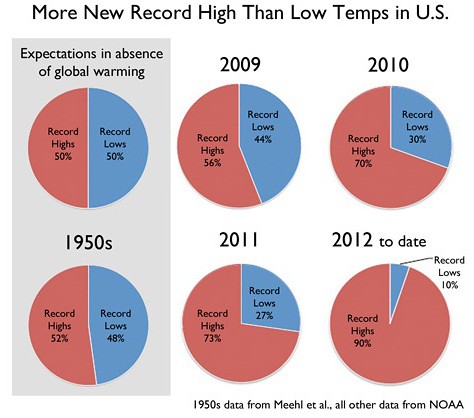
Related: About this forumI have a comment on these temperature record pie charts:
Last edited Wed Jul 11, 2012, 06:16 PM - Edit history (1)
Over and above the obvious conclusion that the temperature distribution is not stationary, the thing that struck me was that not only have we broken 10 times more highs than lows (so far) in 2012, but it's happening the year after we just broke a giant number of record highs. It's quite a run we're having.
http://www.boomantribune.com/story/2012/7/11/121535/620
 = new reply since forum marked as read
Highlight:
NoneDon't highlight anything
5 newestHighlight 5 most recent replies
= new reply since forum marked as read
Highlight:
NoneDon't highlight anything
5 newestHighlight 5 most recent replies

limpyhobbler
(8,244 posts)
flamingdem
(39,335 posts)#thingsoverheardwhilebroilingtodeath
Doctor_J
(36,392 posts)he has appealed to the PTB to break all of these records so that no one will know Climate Change is a hoax.
- Fox "News" goes beyond the headlines.

rgbecker
(4,834 posts)This was told to me by my boss so I know it's true.
GliderGuider
(21,088 posts)GliderGuider
(21,088 posts)
phantom power
(25,966 posts)Demeter
(85,373 posts)Because statistics are much more complex than that, if a proper analysis is done.
There are no simple natural causes of extreme cold. There are a lot of one-step natural causes of extreme warmth: solar fluctuations, vulcanism, CO2 and methane released into the air by natural causes....
An Ice Age, for example...there would have to be reduced solar activity (less energy input) and increased plant growth (less CO2 storage) and more sulfur particulates to increase precipitation so that the snow piled up in the right places...
phantom power
(25,966 posts)My understanding of temperature measurements is that they are generally well modeled as gaussians, or a signal with gaussian noise. So, in any general location and time of year, the data you measure will be gaussian.

hatrack
(59,600 posts)Except, of course, that this one runs counterclockwise.


pscot
(21,024 posts)it might seem as if time is running out.

joshcryer
(62,287 posts)...extreme heat waves. We're going to normalize after it's finished collapsing (in less than 5 years, probably within 3 years). But the new "normal" is going to fucking be insane.
Nihil
(13,508 posts)... not just breaking "a record high" but breaking "a record high set last year
that broke a record high set the year before that broke ..." - i.e., not a spike
but an increasingly sleep slope ...


XemaSab
(60,212 posts)in 2010 the all-time July highs were broken; in 2011 the all-time June highs were broken; and in 2012 the all-time May highs were broken. 

caraher
(6,279 posts)The trouble with the pie charts here is that you get no sense of the "natural" variability. Moreover, you have four consecutive individual years (one of which is a half-year!) compared to a full decade (with a bunch of intervening decades missing).
For a decade-by-decade comparison see this image from a Skeptical Science article:

Admittedly, the decade-level averaging makes it less dramatic, but the trend seems clear enough - the last two decades are certainly much further away from 50/50 than you'd expect by chance, especially the last one. You can also get the sense that having maybe a 25% excess of either highs or lows over a decade might represent a chance fluctuation, while a 2:1 ratio seems almost impossible to explain away as a fluke.
XemaSab
(60,212 posts)If you have 10 years of data (or fish, or kids, or pecan trees, or whatever) the odds of the 11th one being either higher or lower than the other 10 is pretty good. It's not a big data set.
If you have 100 years of data (or fish, or kids, or pecan trees, or whatever), then the odds of the 101st thing breaking the records is a lot smaller.
caraher
(6,279 posts)It's easier to see that the number of new records should decrease with time if all further data does is add to the number of measurements made on an essentially stable expected temperatures - which could lead to some spikes in the ratio if you wind up taking the quotients of small numbers.
But for the most part, if you're seeing random fluctuations only and not some warming or cooling trend yeah, you should be getting closer to 1:1 on average subject to the kind of amplification of noise that can occur when the absolute number of new record temperatures per decade gets small. Even then, if you're talking about something like a few hundred records in a decade that should yield fluctuations on the order of 10%.
It's also noteworthy that even in a "stable climate" scenario the decadal records should still have some nontrivial excursions from the mean climate. For instance, in the '90s we had the Mt. Pinatubo eruption, which should have pushed the ratio down somewhat. It's interesting that even so, there's still a notable excess of record highs recorded.