Economy
Related: About this forumSTOCK MARKET WATCH -- Thursday, 13 July 2023
STOCK MARKET WATCH, Thursday, 13 July 2023
Previous SMW:
SMW for 12 July 2023
AT THE CLOSING BELL ON 12 July 2023
Dow Jones 34,347.43 +86.01 (0.25%)
S&P 500 4,472.16 +32.90 (0.74%)
Nasdaq 13,918.96 +158.26 (1.15%)

+++++++++++++++++++++++++++++++++++++++++++++++++++++++++++++++++++++++
Market Conditions During Trading Hours:
Google Finance
MarketWatch
Bloomberg
Stocktwits
(click on links for latest updates)
+++++++++++++++++++++++++++++++++++++++++++++++++++++++++++++++++++++++
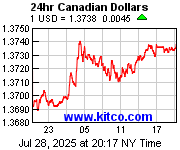
Currencies:
Gold & Silver:
Petroleum:


+++++++++++++++++++++++++++++++++++++++++++++++++++++++++++++++++++++++
DU Economics Group Contributor Megathreads:
Progree's Economic Statistics (with links!)
mahatmakanejeeves' Rail Safety Megathread
mahatmakanejeeves' Oil Train Safety Megathread
+++++++++++++++++++++++++++++++++++++++++++++++++++++++++++++++++++++++
Quote for the Day:
The mentorship on the bomb that Stimson brought Truman had nothing to do with science and everything to do with its use and impact. Like Groves and Oppenheimer, Stimson's professional relationship to the bomb led quickly to a psychological merger with its power. His entailed a kind of distant awe, along with anxious pride at being party to, and in a sense the keeper of, its fearful and yet exquisite mystery. Hence the euphemism for the bomb mentioned earlier – which included not only "the secret" but "my secret."
Robert Jay Lifton and Greg Mitchell. Hiroshima in America: A Half Century of Denial. G. P. Putnam's Sons. © 1995.
This thread contains opinions and observations. Individuals may post their experiences, inferences and opinions on this thread. However, it should not be construed as advice. It is unethical (and probably illegal) for financial recommendations to be given here.
 = new reply since forum marked as read
Highlight:
NoneDon't highlight anything
5 newestHighlight 5 most recent replies
= new reply since forum marked as read
Highlight:
NoneDon't highlight anything
5 newestHighlight 5 most recent replies

bucolic_frolic
(43,436 posts)I escaped a position today at a small profit. I noticed as inflation came down, precious metals moved up. Makes no sense.
Everything moved up, growth more than value. Makes sense. Interest rate cuts are back on the table for 2024 because inflation is down.
Facebook - META - is up 220 points since November 1 2022, now at 309.
BABA - Alibaba - chart looks like the best takeoff in awhile even as stories abound of China collapsing economically.
Biden's White House is the finest integration of policy, economics, and strategy EVER. He either micromanages it all or has the best advisors or manages them better than all the rest.

progree
(10,929 posts)Last edited Thu Jul 13, 2023, 12:16 AM - Edit history (2)
So the purchasing power of the total U.S. stock market fund is up 1.10% since inflation began in about January 2021... that is, since inflation consistently above the 2% target began.
The market: VTSAX Vanguard Total Stock Market Index Fund (total U.S. stock market)
https://finance.yahoo.com/quote/VTSAX/history
Using the Adjusted Close figures which are adjusted for reinvested dividends. Thus these are total return figures:
1/1/21: 91.66
7/12/23: 107.42
+17.19%
Inflation: CPI:
https://data.bls.gov/timeseries/CUSR0000SA0
1'21: 262.650 (1'21 means January 2021)
6'23: 303.841
7'23: 304.449 (I just made it 0.2% higher than 6'23)
+15.91%
Real (inflation-adjusted) market up 107.42/91.66 * 262.650/304.449 = 1.01104 => 1.10%.
As for when sustained inflation above the Fed's 2.0% target began: It went above the pre-pandemic approximately 2.0% trendline in around January-February 2021
https://fred.stlouisfed.org/series/CPIAUCSL
IMGUR beginning May 2017 
One has to get their straight edge out -- I couldn't figure out how to draw a straight line on the graph at IMGUR or the Windows Snip Tool.
I've also looked at every CPI graph from month-by-month to rolling 3 month averages, 6 month averages, 12 month averages, even rolling 36 month averages, so I'm comfortable that January 2021 is close.
Another interesting thing about the above graph is that the inflection point where inflation began a marked slowdown is clear on the graph: around June or July 2022. That X-axis label that is obscured by the "i" in Picsart is July 2022, and that's about where the "kink" is. No surprise: the month over month figures in May 2022 is 0.9% and June is 1.2%, followed by 0.0% and 0.2% in July and August 2022 respectively, making for a rather sharp change in slope.
As for the current CPI and core CPI trends (in the past 13 months or so):
https://www.democraticunderground.com/10143099462#post12