General Discussion
Related: Editorials & Other Articles, Issue Forums, Alliance Forums, Region ForumsFactcheck.org releases devastating graph silencing GOP's favorite talking point
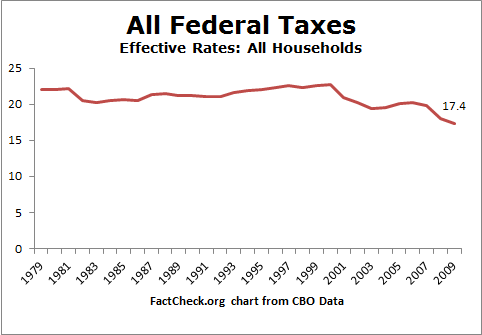
Federal Taxes are now at their lowest in the last 30 years during the Obama administration:
This graph should be used in ads all over America. Misinformation to the contrary is spread daily by right-wing bloggers, Fox News, etc.
Link to graph.
Link to article: http://factcheck.org/2012/07/tax-facts-lowest-rates-in-30-years/
 = new reply since forum marked as read
Highlight:
NoneDon't highlight anything
5 newestHighlight 5 most recent replies
= new reply since forum marked as read
Highlight:
NoneDon't highlight anything
5 newestHighlight 5 most recent replies
Sheepshank
(12,504 posts)It's all they really have.

madamesilverspurs
(15,813 posts)
Enrique
(27,461 posts)

progressoid
(50,008 posts)I need to wash my eyes now.


freshwest
(53,661 posts)

chknltl
(10,558 posts)
siligut
(12,272 posts)But it is a very good graph and dispels the myth that the reTHUGs love to push.

amuse bouche
(3,657 posts)hate facts. Facts give them indigestion

Iliyah
(25,111 posts)because their collective masters will tell them so.
xtraxritical
(3,576 posts)It's a bold faced lie but they keep saying it ad nausea until their low information voters remember the meme.

Dalai_1
(1,301 posts)VWolf
(3,944 posts)
Igel
(35,383 posts)Perhaps just against those who say that "Americans pay too many taxes."
We like this graph because it helps us in an argument.
Of course, it means that those who say the * tax cuts made the middle class pay more are just wrong. Their argument's squashed. And it means that if we want to truly eliminate the federal income tax for the most indigent we have to reduce corporate income tax rates to 0%. That's not just a possible interpretation of the factcheck graphic, spin: That's a required interpretation. Because that's their definition.
It also means that since most still say a "tax reduction is stimulatory" we should all take a 50% pay cut. That would certainly reduce the effective rate of taxation, wouldn't it? No more 28% tax rates for anybody. Yup, that's entailed by the way people are interpreting the factcheck blurb.
It means, since we think of federal revenues as directly reflecting effective rates which must reflect marginal rates, that the best possible stimulus for the economy is a severe recession.
In my undergrad classes we were taught to build theory. We started with data and definitions--data was good, definitions were malleable--and proceded to look at more and more data. The idea was to build a theory that accommodated the data and was testable. The single biggest problem that the undergrads had was in realizing that you can't change definitions mid-sentence, mid-thought; or mid-paragraph; or mid-theory. They'd gleefully change a definition that served in a theory that handled 25 data sets in order to accommodate what was in front of them at the moment--even if it meant that they lost their theory for the other 25. When it was pointed out to them, they failed to remember how to understand the rest of the theory or why the definition was important. For the final, they were given a handout of the theory as it stood on the last day. They were happy--that was "what we needed to know." They were idiots: They needed to understand the theory, not "know" it; and they needed to know how you'd change a theory. Because the final exam was more of the same. "Here are data: How does this change your theory? Here are more data: What parts of the theory that you changed need to be changed again?" It was a good way of differentiating between those who could think critically and those who just wanted to memorize or score easy points for their GPA.
The factcheck.org blurb is good for some arguments. But for the most part, it cuts both ways--and if the people factcheck is "debunking" were given the chance, they'd make clearer that the factcheck blurb is mostly relying on ambiguity in definitions for any kind of relevance.
zentrum
(9,865 posts)17% is what the richest pay because they stash their income in investments which are taxed at the 15% rate.
Middle Class and Working Class people pay closer to 25% to 33% because their salaries are taxed and they have very little capital gains tax.
I find this chart very confusing, though I get the main point about tax history.
hay rick
(7,650 posts)Middle income families have a significant portion of their income protected by personal exemptions and the mortgage interest deduction.
Remember too, that your top marginal tax rate applies to the last dollar you made, not your entire income. In 2011, the tax rates for a single person, after deductions, were:
10% on taxable income from $0 to $8,500, plus
15% on taxable income over $8,500 to $34,500, plus
25% on taxable income over $34,500 to $83,600...
So, for example, a single person with a $40,000 taxable income has a top marginal rate of 25%, but actually pays $6125 in income tax for an effective rate of 15.3% on taxable income. His tax rate on gross income (before deductions) would be even less. His total federal tax burden is increased mainly by the payroll taxes (fica and medicare) and excise taxes (gas, alcohol, tobacco, etc.).
from the article:
"Meanwhile, rates for those in the middle dropped to a 30-year low of 11.1 percent in 2009, down from the 19.2 percent peak rate of 1981. That’s for the middle one-fifth of all households, those with incomes between $34,900 and $50,100 for singles, or between $69,800 and $100,200 for a family of four.
As we’ve noted before, the nation’s current string of trillion-dollar deficits results from historically high spending and historically low revenues. We noted in our June 4 article that President Obama’s spending levels are near the highest level since World War II, measured as a percentage of the nation’s gross domestic product. And we also noted that tax receipts were the lowest since 1950, as a percentage of GDP."
Nye Bevan
(25,406 posts)According to this thread, they've "lost it", "shot themselves in the foot", and are "owned by the Koch Brothers".
http://www.democraticunderground.com/1002938786
I guess it depends upon what facts are being checked.