General Discussion
Related: Editorials & Other Articles, Issue Forums, Alliance Forums, Region ForumsWith the country's attention turned north, the coronavirus pandemic is exploding in Louisiana.

https://www.theatlantic.com/politics/archive/2020/03/coronavirus-pandemic-coming-new-orleans/608821/
Between the time this sentence was written and the time this article is published, hundreds more Americans will likely have died from COVID-19. Hundreds or perhaps thousands more people will have been hospitalized, and certainly tens of thousands more will have tested positive for the coronavirus. At this point, making predictions about the pandemic is like riding a barrel over Niagara Falls: We can only guess how it ends, but we do know things are going down.
Here’s another prediction that’s safe to make: The city of New Orleans—and, potentially, all of Louisiana—is going to become the next front in the fight against the pandemic. Even as national attention is justifiably focused on the aggressive outbreak in Washington State and the mounting pressures on New York City’s hospitals, the virus’s advance in Louisiana has shaken local officials and doctors, and the state is already approaching a similar burden of infections and deaths as the crises to the north. There’s good reason to believe that this southern outbreak will be even more difficult to contain, and is perhaps a better harbinger of what’s to come as the pandemic spreads across the country.
The numbers already indicate that Louisiana is a global epicenter of the pandemic. Just over 1 percent of the U.S. population lives in Louisiana. But according to the COVID Tracking Project, 7 percent of all COVID-19 deaths, 7 percent of all hospitalizations, and 3 percent of all positive tests have been in the state. New York has suffered about two deaths per 100,000 residents. Louisiana is at 1.8.
To put the numbers into perspective, if Louisiana were a country, its death count would put it in the top 15 globally. The burden appears to be increasing so quickly that all of these statistics will become quickly out of date. The state reported 83 total deaths from COVID-19 as of noon yesterday. It had reported 34 as of Monday. And, as is the nature of this virus, most of the reported data represent only a snapshot of the infections that took place a week or two ago. Hospitalizations and deaths will increase. And, if other outbreaks around the world are any example, the curve will not rise gently. The fallout in Louisiana will be most painful in the New Orleans metropolitan area, whose Orleans and Jefferson Parishes account for two-thirds of all cases in the state.
snip
 = new reply since forum marked as read
Highlight:
NoneDon't highlight anything
5 newestHighlight 5 most recent replies
= new reply since forum marked as read
Highlight:
NoneDon't highlight anything
5 newestHighlight 5 most recent replies

Strelnikov_
(7,772 posts)“We have a sicker populace in Louisiana with more co-morbidities” — underlying illnesses such as diabetes, hypertension and obesity — “than a lot of other cities do in the country,” said Kanter from the state health department. “Yes, we think that the people of Louisiana have a high degree of vulnerability, and we’re worried that that might translate into a higher percentage of hospitalization.”
Simon Johnson, a professor at MIT, has developed a model that pinpoints Louisiana as the next place “where covid-19 will wreak havoc.” The co-director of MIT’s coronavirus alliance and his team assigned risk scores to every county in the United States based on the medical factors that make a person vulnerable to severe illness from coronavirus: age, obesity, diabetes and hypertension. The areas that he says were “flashing red” as having high rates of all of those are Louisiana and its neighbors Alabama and Mississippi.
“This is what we believe happened in Bergamo,” he said, referring to a region of Italy that has been hit hard by the virus. “It was a lot of vulnerable people living together in close quarters that caused the devastation.”
https://www.washingtonpost.com/national/coronavirus-new-orleans-mardi-gras/2020/03/26/8c8e23c8-6fbb-11ea-b148-e4ce3fbd85b5_story.html?outputType=amp
++++
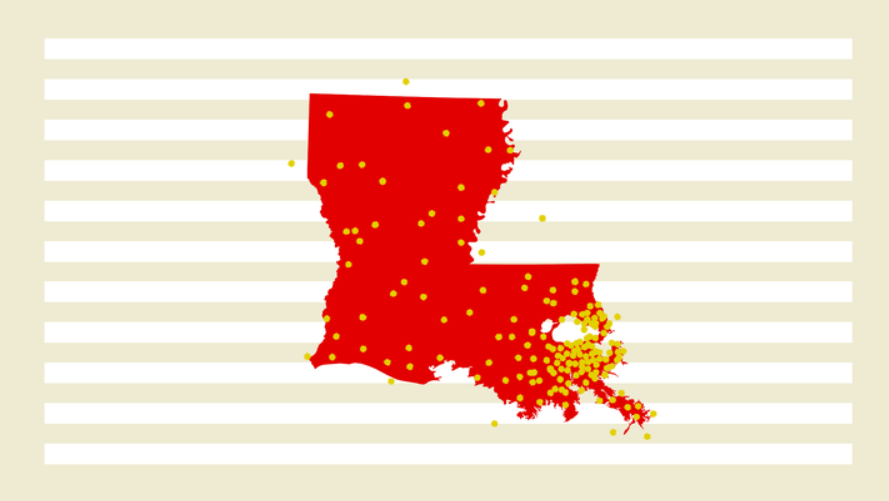
"COVID-19 Relative Risk Factors Comparison per State"
https://www.covidalliance.com/interactive-data-tools
The interactive map represents a relative risk profile of counties within each state. The red areas on the map represent regions with higher relative risk compared to the white ones. To categorize counties e produced a score that ranges from 0 to 6, 6 being the highest risk. For each of the risk factors a county can be given 2, 1, or 0 points if it belongs to the top 25%, top 50%, or bottom 50% of counties in the state, respectively. The risk profile was created on the basis of three categories – hypertension, diabetes, and obesity.
We have overlaid the number of known COVID-19 cases in the form of blue circles on top of the corresponding county.[i/]

58Sunliner
(4,372 posts)dustyscamp
(2,223 posts)John Neely Kennedy